The j_ima_iros software package has been developed to provide two main outputs:
In addition, since OSA v.11, j_ima_iros can also provide source lightcurves (parameter LCR_useIROS). The lightcurves produced through j_ima_iros benefit from the detailed modelling of the instrument response, which over the years have been included in j_ima_iros.
j_ima_iros processes data (shadowgrams) from one science window at a time. Combining the sky images or the source candidate lists is done by subsequent software packages. j_ima_iros can analyze a maximum of 15 shadowgrams (f.i. 15 separate energy bands) from one science window. For an initial survey of the observed sources we suggest to divide the data into a limited number of energy bands, e.g. four bands.
j_ima_iros generates its sky images by a simple backprojection
algorithm. The necessary information for this step is to see
if the path from the detector pixel to the sky pixel is free or
blocked by e.g. collimator or mask.
Since the geometry of the JEM-X detector with its collimator
is complex, the raytracing from shadowgram pixels to sky image pixels is quite time
consuming. Therefore the Aperture Response Function is calculated off-line by a separate set of
subroutines. For every detector pixel (= shadowgram pixel) a list is
generated containing all sky-image pixels potentially illuminating
this given detector pixel. Even when stored in compressed format these
"backprojection lists" are of substantial size: about 375 Mbyte
(for each JEM-X unit) for sky images with 511x511 pixels of 1.5 arcmin.
The advantage is that the backprojection process (which must
be repeated many times during the IROS-process) is quite fast - and,
very important, the duration of the backprojection step is independent
of the steadily increasing complexity of the raytracing model required
by our improved understanding of the intricacies of JEM-X.
The backprojection lists are stored as separate IC files JMXi-BPL.-GRP
under the general IC tree.
The search for sources is conducted in three predefined energy bands
irrespective of the user selection of energy bands.
Once the sources have been located, the results for each of them
will be computed and reported for all energy bands selected by the user.
Sources found in two or three
of the search bands will define a 'basic source set' for the given
observation![[*]](footnote.png) .
For strong source candidates found during the first source detection
phase of j_ima_iros a catalog match will be searched. If found, the
catalog coordinates will be used during the IROS process.
.
For strong source candidates found during the first source detection
phase of j_ima_iros a catalog match will be searched. If found, the
catalog coordinates will be used during the IROS process.
Optionally, the user may specify a 'user catalog' (parameter: usrCat)
to enhance and control the performance of j_ima_iros. A subset of
the sources in this catalog will automatically be selected corresponding to the
current field of view.
The user may want to force j_ima_iros to analyze a source which
is not detected with sufficient strength to be included in the
basic source set. This can be done by assigning specific values
to the 'FLAG' column of the user catalog.
A value of one will force j_ima_iros to derive flux values for the
source. The flux will be derived from a fit including the basic
source set plus the desired source. If several sources are marked
in this way, a separate fit is performed for each source together
with the basic source set.
Setting FLAG to 3 will force j_ima_iros to include the given
source in the basic source set. It can be useful for very strong
sources near the edge of the FOV that are not detected because they
are too close to the edge or the exposure time is too short.
But beware! Forcing irrelevant sources into the IROS process
will normally deteriorate the fit.
When requested, j_ima_iros will produce light curves for all sources
included in the basic source set, for the energy ranges and time bins specified
by the user. Lightcurves will also be produced for the sources listed in
the user catalog and having FLAG column of 1 or 3, similarly to the
case described above.
In addition the user can request all the iros-lightcurves to be searched for
burst activity.
See Sect. ![[*]](crossref.png) for a more detailed explanation of the new lightcurve
feature of j_ima_iros and for the list of parameters that can be
used to control it.
for a more detailed explanation of the new lightcurve
feature of j_ima_iros and for the list of parameters that can be
used to control it.
The pixel size in the sky image is 1.5arcmin and the dimensions are 511 511 pixels.
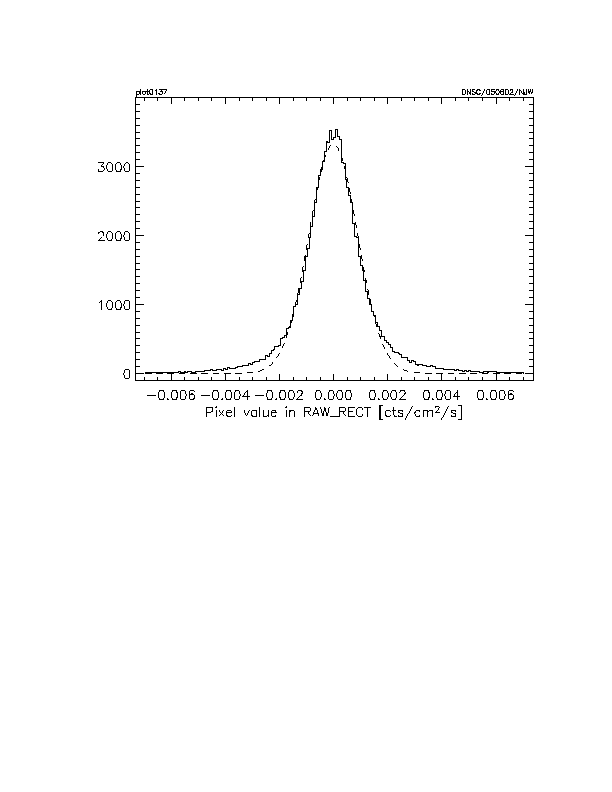
The distribution of pixel values in the reconstructed and cleaned
image (RECONSTRUCTED) is not Gaussian (see Fig. ) which
implies that the detection significance limit should be set
somewhat higher e.g. to 12, than a ``number of sigma's''
 |
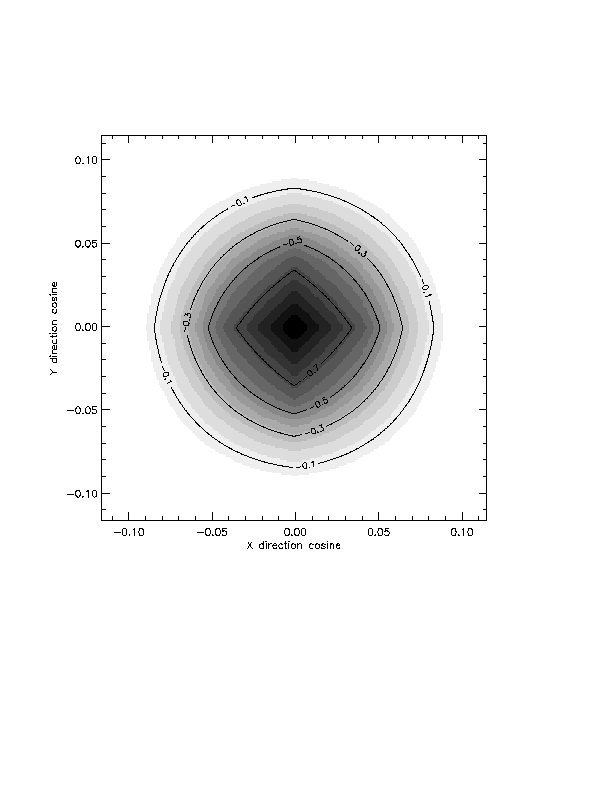
The presence of the collimator introduces a vignetting of off-axis sources.
Also at off-axis angles greater that 2.4 degrees a source is not visible
through the mask from the entire detector surface. These two effects
together form the vignetting. The vignetting or throughput factor as a
function of angle in two direction is shown in Fig. .
The quadratic cell shape of the collimator introduces the deviation from
circular symmetry.
With OSA5.1 images it was realized that the flux determined from the images was a decreasing function of the off-axis angle. This effect is corrected in OSA6 by applying a correction map placed in the BPL IC files to the images before they are written to disk. Therefore the offline tool 'mosaic_spec' can be used to extract source spectra from j_ima_iros images as well as from mosaic images.