Next: Spectral Extraction using spimodfit
Up: Cookbook
Previous: Spectral extraction of variable
Contents
Broad band spectrum using spiros
SPI data in the 400
2200 keV energy range
(
keV until revolution 1170, May 2012) show spectral artifacts
caused by high-energy particles which saturate the main electronic
chain (called Analogue Front-End Electronics, AFEE) and generate
false triggers.
However, a fraction of the signals produced by the photons interacting
with the detectors are sent to a second electronic chain,
the Pulse Shape Discriminator (PSD), independent from the main one.
These events are not affected by the saturation problem that
generates false triggers in AFEE.
Here is important to recall that the single events analysed by AFEE
are labeled as SE, while those analysed by PSD are labeled
as PE![[*]](footnote.png) .
Since the fraction of PE events is significantly lower than SE events
in the range
keV, the user aiming at studying the X-ray
emission of sources over a broad energy range have to create two spectra:
.
Since the fraction of PE events is significantly lower than SE events
in the range
keV, the user aiming at studying the X-ray
emission of sources over a broad energy range have to create two spectra:
- ``SE+PE spectrum'', based on SE and PE events, in the energy ranges
keV and
MeV (
keV and
MeV for observations taken before May 2012);
- ``PE spectrum'', based on PE events, in the energy range
keV (
keV for observations taken before May 2012).
Once the spectra are created, they can be fitted with xspec.
In order to simplify the procedures that the user should follow
during the spectral analysis stage, a script (spi_spec_glue.py)
can be used to automatically stick together SE+PE and PE spectra.
The script is publicly available at:
http://isdc.unige.ch/integral/download/spi/scripts/spi_spec_glue.py//
The PSD electronics sub-system has an efficiency of
%
on its energy domain because of a relatively high dead time.
spi_spec_glue.py automatically corrects the fluxes and uncertainties
in the energy range
keV (or
keV for observations before 2012 May)
with the efficiency factor
.
Hereafteer, an illustrative example of the data analyisis method to be used is shown.
It is based on the same (cleaned) data set of Sect. ![[*]](crossref.png) .
.
First, you have to create the ``SE+PE'' spectrum in the range 20
2200 keV.
Launch spi_science_analysis, click on ``Energy definition'' button;
then, in the new window set ``Regions energy boundaries'' 20,2200
and ``Number of bins'' -35.
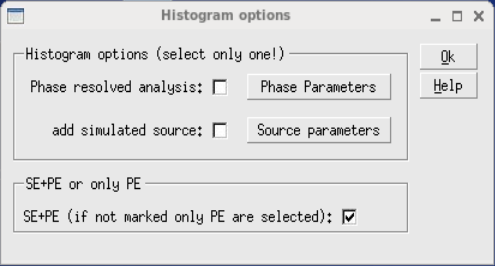
Since the ``SE+PE'' option in the ``Histogram options'' window is selected
by default (Fig. ), a ``SE+PE'' spectrum will be created.
For the other options, follow the method described in Sect. .
Click on ``Ok'' and then on ``Run'' button.
Figure:
``Histogram options'' window with ``SE+PE'' option selected by default
|
|
Then, you can create the response file, update the keywords in the header of
spectrum_Ginga_2023.fits (see Sect. ),
and rename the file:
mv spectrum_Ginga_2023.fits spectrum_Ginga_2023_SEPE.fits
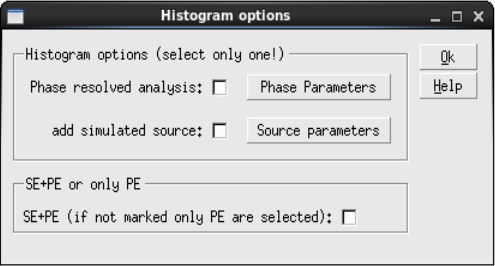
To create the PE spectrum, launch again spi_science_analysis,
click on ``Histogram options" button and un-select ``SE+PE'' option (Fig. ).
Click ``Ok'' to close the ``Histogram options'' window.
Figure:
``Histogram options'' window with ``SE+PE'' option un-selected.
|
|
Note that the PE spectrum needs to be created from
flat-fields specifically created for spectra based on PE events.
They are made available in the ic/spi/cal directory with
the new release of OSA (version 11).
spi_science_analysis selects and uses the appropriate flat-field
(``SE+PE'' or ``PE'') automatically.
If you want to use another flat-field for the ``flatfield DOL''
in the panel of Fig. , you can choose between
these flat-fields (an appropriate path is required):
- spi_flpe_grp_0056.fits, revolution 72, to be used for all revolutions up to 140, i.e., with all 19 detector
live,
- spi_flpe_grp_0057.fits, revolution 158, to be used for revolutions 142 to 214, i.e., with 18 live detector
(excluding number 2),
- spi_flpe_grp_0058.fits, revolution 220, to be used for revolutions 215 to 281, i.e., with 17 live detectors
(excluding 2 and 17),
- spi_flpe_grp_0059.fits, revolution 343-344, to be used for revolutions 282 to 399, i.e., with 17 live detectors
(excluding 2 and 17),
- spi_flpe_grp_0060.fits, revolution 456-457, to be used for revolutions 400 to 488, i.e., with 17 live detectors
(excluding 2 and 17),
- spi_flpe_grp_0061.fits, revolution 521-522, to be used for revolutions 489 to 587, i.e., with 17 live detectors
(excluding 2 and 17),
- spi_flpe_grp_0062.fits, revolution 653-654, to be used for revolutions 588 to 775, i.e., with 17 live detectors
(excluding 2 and 17),
- spi_flpe_grp_0063.fits, revolution 807-810, to be used for revolutions 776 to 930
(till pointing 093000310010, the last pointing with 17 live detectors), i.e., with 16 live detectors
(excluding 2, 5, and 17).
- spi_flpe_grp_0064.fits, revolution 957, to be used for revolutions 930 (from pointing 093000330010,
the first pointing with 15 live detectors) to 980, i.e., with 15 live detectors
(excluding 1, 2, 5, and 17).
- spi_flpe_grp_0065.fits, revolution 1014-1016, to be used for revolutions 981 to 1040, i.e., with 15 live detectors
(excluding 1, 2, 5, and 17).
- spi_flpe_grp_0066.fits, revolution 1084, 1085, 1086, to be used for revolutions 1041 to 1112, i.e., with 15 live detectors
(excluding 1, 2, 5, and 17).
- spi_flpe_grp_0067.fits, revolution 1129, 1130, 1131, 1132, to be used for revolutions 1113 to 1180, i.e., with 15 live detectors
(excluding 1, 2, 5, and 17).
- spi_flpe_grp_0068.fits, revolution 1185, 1186, 1187, 1188, 1189, 1200, 1201, 1204, 1206,
to be used for revolutions 1181 to 1210, i.e., with 15 live detectors
(excluding 1, 2, 5, and 17).
- spi_flpe_grp_0069.fits, revolution 1238-1239, to be used for revolutions 1211 to 1248, i.e., with 15 live detectors
(excluding 1, 2, 5, and 17).
- spi_flpe_grp_0070.fits, revolution 1307, 1310, to be used for revolutions 1249 to 1318, i.e., with 15 live detectors
(excluding 1, 2, 5, and 17).
- spi_flpe_grp_0071.fits, revolution 1352, 1353, 1354, 1356, 1357, 1358, 1360, to be used for revolutions 1319 to 1375, i.e., with 15 live detectors
(excluding 1, 2, 5, and 17).
- spi_flpe_grp_0072.fits, revolution 1380, 1381, 1382, 1383, 1384, 1385, 1386, 1388, to be used for revolutions 1376 to 1451, i.e., with 15 live detectors
(excluding 1, 2, 5, and 17).
- spi_flpe_grp_0073.fits, revolution 1459, 1463, 1470, 1472, 1476, 1478, to be used from revolution 1452 to 1509, i.e., with 15 live detectors
(excluding 1, 2, 5, and 17).
- spi_flpe_grp_0074.fits, revolution 1546 (ScWs: 1-48), 1547 (ScWs 1-49), 1548 (ScWs: 1-49), to be used from revolution 1510 to 1589, with 15 live detectors (excluding 1, 2, 5, and 17).
- spi_flpe_grp_0075.fits, revolution 1612 (ScWs: 53-87), 1615 (ScWs 55-84), 1617 (ScWs: 7-53), 1630 (ScWs 1-52), to be used from revolution 1590 to 1652, with 15 live detectors (excluding 1, 2, 5, and 17).
- spi_flpe_grp_0076.fits, revolution 1671 (ScWs: 30-**), 1673 (ScWs: all), 1681 (ScWs: 25-48), 1682 (ScWs: all), 1683 (ScWs: 1-53), to be used from revolution 1656 to 1705, with 15 live detectors (excluding 1, 2, 5, and 17).
- spi_flpe_grp_0077.fits, revolution 1671 (ScWs: 30-**), 1753 (ScWs: 5-56), 1754 (ScWs: 1-55), 1755 (ScWs: 1-54), to be used from revolution 1706 to 1773, with 15 live detectors (excluding 1, 2, 5, and 17).
- spi_flpe_grp_0078.fits, revolution 1826 (ScWs: 1-6, 10-33), 1827 (ScWs: 30-67), 1829 (ScWs: 36-70), 1830 (ScWs: 4-55), 1831 (ScWs: 2-27), 1832 (ScWs: 23-55), 1835 (ScWs: 1-54), 1836 (ScWs: 1-53), to be used from revolution 1774 to 1843, with 15 live detectors (excluding 1, 2, 5, and 17).
- spi_flpe_grp_0079.fits, revolution 1869 (ScWs: 1-50), 1870 (ScWs: 1-50), 1873 (ScWs: 1-18, 21-37), 1874 (ScWs: 1-40), to be used from revolution 1844, with 15 live detectors (excluding 1, 2, 5, and 17).
In this example we suggest to leave the ``flatfield DOL'' field empty.
In this way, spi_science_analysis will select spi_flpe_grp_0073.fits automatically.
Click ``Run'' in the main GUI.
spi_science_analysis will create the ``PE spectrum'' spectrum_Ginga_2023.fits.
You can rename it:
mv spectrum_Ginga_2023.fits spectrum_Ginga_2023_PE.fits
Then you have to create the response matrix and update the keywords of
spectrum_Ginga_2023_PE.fits.
You might notice in the spi_sa*.log logfile that some errors like:
Error -210102 and NAG status ** getting a Bunch-Kaufmann matrix factorization with NAG
routine
occur for energy bins with energy
keV.
This is due to the insufficient statistics of the PE spectrum at low energies.
Since the PE spectrum is relevant in the energy range
keV,
these errors can be neglected.
As mentioned above, once the ``SE+PE'' and ``PE'' spectra are created,
you can use the script spi_spec_glue.py
to stick them together:
[user@machine spi_analysis]$ python spi_spec_glue.py
Enter the SE+PE filename: 'spectrum_Ginga_2023_SEPE.fits'
Enter the PE filename: 'spectrum_Ginga_2023_PE.fits'
Enter the spectral response filename: 'spectral_response.rmf.fits'
Enter extension number: 36
spi_spec_glue.py will create the file spectrum.fits.
The extension 36 contains the spectrum obtained from
spectrum_Ginga_2023_SEPE.fits (energy bins before
keV) and
spectrum_Ginga_2023_PE.fits (energy bins above
keV),
already corrected for the PSD efficiency.
You can modify the parameters energy_th (default: 400 keV; to be set
keV
for observations performed before 2012 May)
and pe_eff (i.e. PSD efficiency; default: 0.85) in the spi_spec_glue.py script.
Next: Spectral Extraction using spimodfit
Up: Cookbook
Previous: Spectral extraction of variable
Contents
inthelp@sciops.esa.int