Next: Dithering Sensitivity Degradation
Up: Measured Performance
Previous: Spectral Resolution
Contents
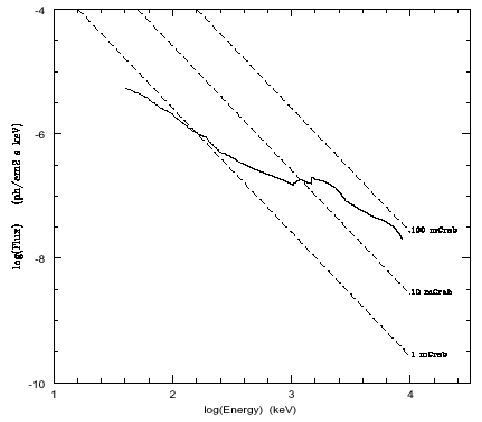
The continuum and line sensitivities of the SPI instrument are given
in Figure ![[*]](crossref.png) and Figure , respectively. The continuum
sensitivities are for
, and are calculated using the
narrow line sensitivity divided by
,
where R is the instrument resolution for lines. The line
sensitivities are fluxes in photons cm
s
, the
continuum sensitivities are fluxes in photons cm
s
keV
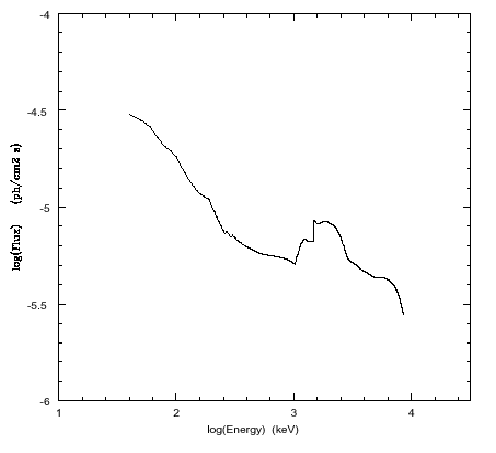
. The line sensitivities are for narrow lines. The 511 keV
sensitivity is worse than the surrounding continuum due to the strong
511 keV background line originating in the instrument.
and Figure , respectively. The continuum
sensitivities are for
, and are calculated using the
narrow line sensitivity divided by
,
where R is the instrument resolution for lines. The line
sensitivities are fluxes in photons cm
s
, the
continuum sensitivities are fluxes in photons cm
s
keV
. The line sensitivities are for narrow lines. The 511 keV
sensitivity is worse than the surrounding continuum due to the strong
511 keV background line originating in the instrument.
Figure:
The continuum sensitivity of the SPI
instrument for a 3 sigma detection in 10
seconds, on axis.
The fluxes are for
The dashed lines indicate
extrapolations from the X-rays using a powerlaw with photon index
-2 for 1, 10 and 100 mCrab.
|
|
Figure:
The narrow line sensitivity of the
SPI instrument for a 3 sigma detection in 10
s. Note
that the 511 keV line is not shown in this figure.
|
|
Next: Dithering Sensitivity Degradation
Up: Measured Performance
Previous: Spectral Resolution
Contents
inthelp@sciops.esa.int