Using the mosaic_spec script one can extract the source spectra from mosaic images and from individual ScW images. To extract spectra from a mosaic one needs first to produce images in narrow energy bands (to get a reasonable number of energy bins in the resulting spectrum).
As an example, let us extract the spectrum of 4U 1722-30 from the mosaic images. First, one needs to create a new observation group using the list of ScWs considered for the mosaic of the Galactic Center region:
cd $REP_BASE_PROD
og_create idxSwg=mos.lst ogid=mosspec baseDir="./" instrument=JMX2
cd obs/mosspec
Next, one needs to produce the sky images in the 16 chosen energy bins.
jemx_science_analysis startLevel="COR" endLevel="IMA2" nChanBins=-4\
   skipLevels="LCR,SPE,BIN_S,BIN_T" jemxNum=2
The above command will produce JEM-X sky images and the mosaic in the 16 standard energy bands. Default parameter setting will ensure that the output can be used with mosaic_spec, the relevant parameters are:
IMA\_skyImagesOut="RECONSTRUCTED,VARIANCE"
IMA\_detImagesOut=no
IMA\_userImagesOut=yes
IMA2\_viewVar=Y
Now you can find the spectrum of any of the sources (and even extract a spectrum or energy-dependent upper limit of the flux from any position on the sky) from the sky images in each ScW, using the mosaic_spec script. E.g. the command
cd scw/005300410010.001
mosaic_spec "" "" DOL_idx="jmx2_sky_ima.fits"\
   DOL_spec="spectrum_scw.fits(JMX2-PHA1-SPE.tpl)"\
   EXTNAME="JMX2-SKY.-IMA" ra=261.89 dec=-30.80 \
   posmode=0 widthmode=-2 Intensity="RECONSTRUCTED"
will extract the spectrum from the position on the sky RA=261.89 ,
DEC=-30.80 corresponding to the position of 4U 1722
30. The spectrum
will be written in the file spectrum scw.fits (using the template specified
in the template file JMX2-PHA1-SPE.tpl). A number of parameters of the
mosaic spec script specify
the way in which the source flux and error are extracted from the sky image.
In general, the script attempts to fit a Gaussian to the excess of intensity
at the position of the source. The parameter posmode=0 specifies that the
source position always should be left free (-1 would freeze the source
coordinates, as the user may prefer to do with relatively weak
sources).
The parameter widthmode=-2 specifies that the width of the
fitted Gaussian should be read from the JEM-X image.
The parameter Intensity specifies which of the possible intensity
images will be used for the spectral extraction (only RECONSTRUCTED or
RECTIFIED can be meaningfully used; RECONSTRUCTED is recommended).
For JEM-X, the use of the size parameter
(that in the past was set to size=7) is now obsolete.
To extract the spectrum from the mosaic image, go to the directory which contains jmx2_mosa_ima.fits and run mosaic_spec in the following way
cd ../../
mosaic_spec "" "" DOL_idx="jmx2_mosa_ima.fits"\
   DOL_spec="spectrum_mosa.fits(JMX2-PHA1-SPE.tpl)"\
   EXTNAME="JMX2-MOSA-IMA" ximg=0 yimg=0\
   ra=261.89 dec=-30.80 posmode=0 widthmode=-1 psf=2.0 Intensity="RECONSTRUCTED"
As a result, a spectrum spectrum_mosa.fits will be extracted from the sky position of 4U 1722 30. In this second case, we used the combination of parameters
widthmode=-1 psf=2.0, as the PSF of mosaic images is slightly larger
than the PSF of single pointing images.
To analyse the spectra, you need to rebin the response matrix with the help of ftool j_rebin_rmf, as it is explained above.
The ancillary response function (ARF) for JEM-X2 spectra, can be automatically extracted from the IC tree using the script j_image_arf:
j_image_arf jemx_num=2 outfile=jmx2_image_arf.fitsNote that this ARF can only be used with spectra extracted with mosaic_spec, either for ScW images or from mosaics. The ARFs to be used when running the SPE step and spe_pick are different, and are automatically found and attached to the spectra by the jemx_science_analysis script.
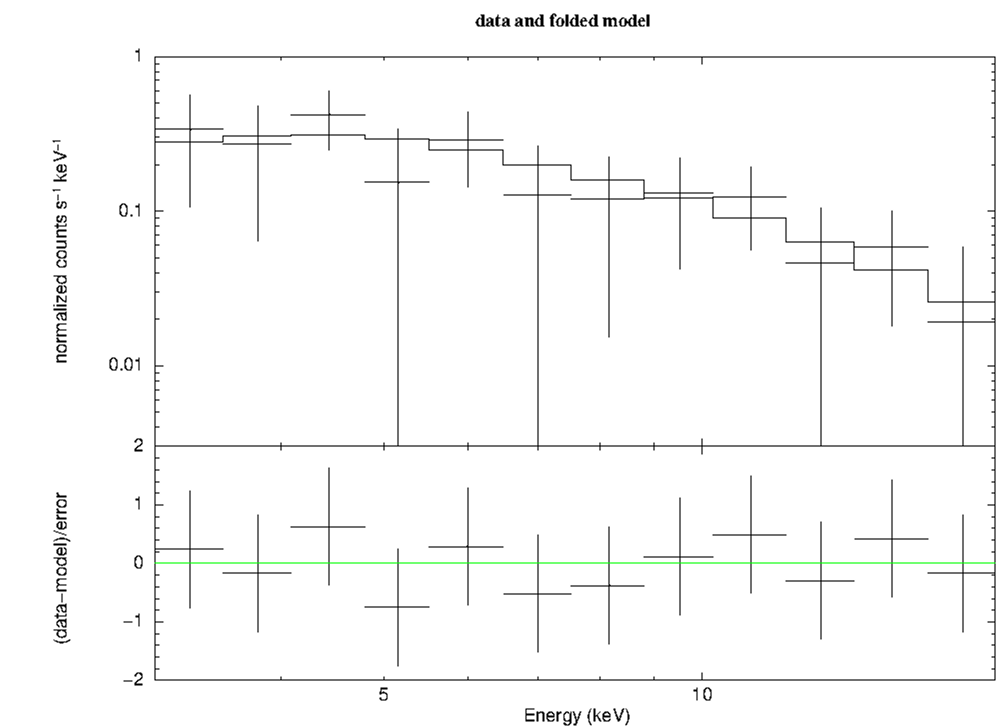
Now you can enter the spectra extracted from the images in the individual ScWs and from the mosaic image into XSPEC and analyse them in a way similar to the one described in the previous sections.
xspec
data spectrum_mosa.fits
resp jemx_rebinned_rmf.fits
arf jmx2_image_arf.fits
cpd /xw
setplot energy
plot ldata
.......
The resulting spectrum is shown in Fig. 21. Please note that mosaic_spec flags with quality those bins where the signal to noise ratio is below 5. This causes Xspec to discard these data points in the spectral fitting. It is possible to use these points by changing the quality flag to zero using ,e.g., the fv fits editor.