| INTEGRALPlanckGaiaPOLARCHEOPSEuclidATHENA |
| HEAVENSFACTCTALOFTSPICAJEM-EUSOXIPEeXTPTheseus |
| XRISMMAGBOUNDSMARTNet |
| ISDCCDCI |
| INTEGRAL Science Data Centre |
ISDC Image Gallery
 7 DEC 2012
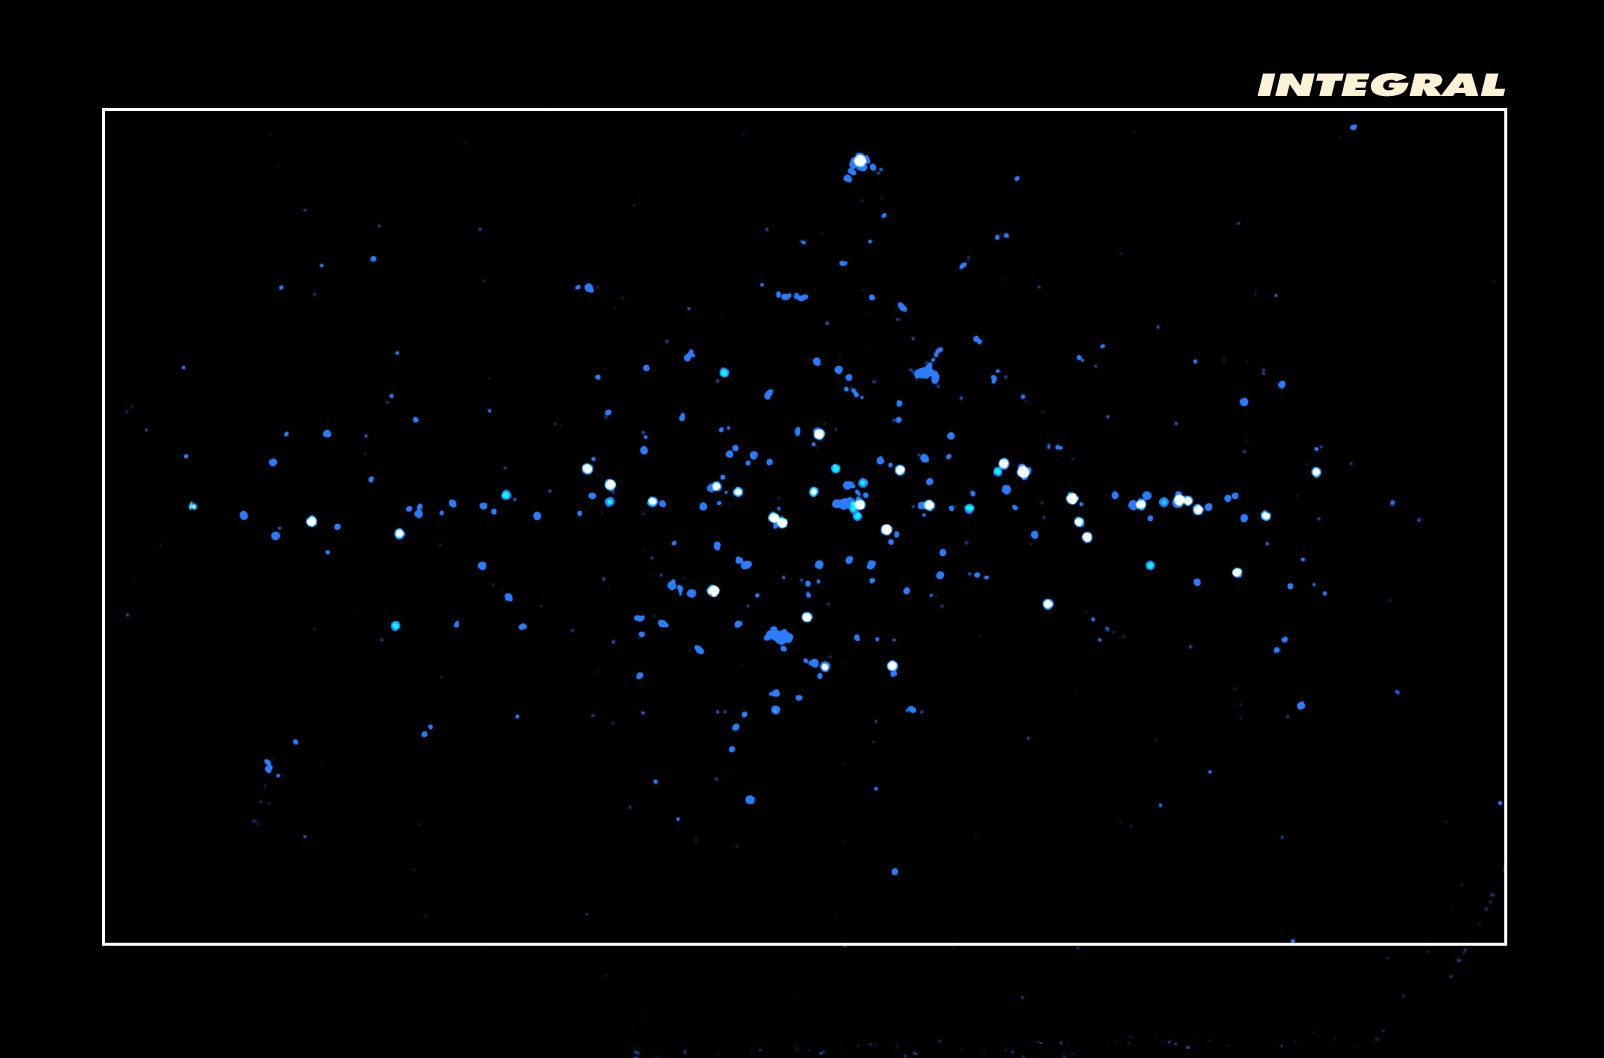
Credits: ESA/Bouchet et al. Spatial distribution of the 511 keV gamma-ray line from the positron annihilation in the central region of the Milky Way. The main emission is roughly circular, but weak emission is also detected along the Galactic plane. |
 9 NOV 2012
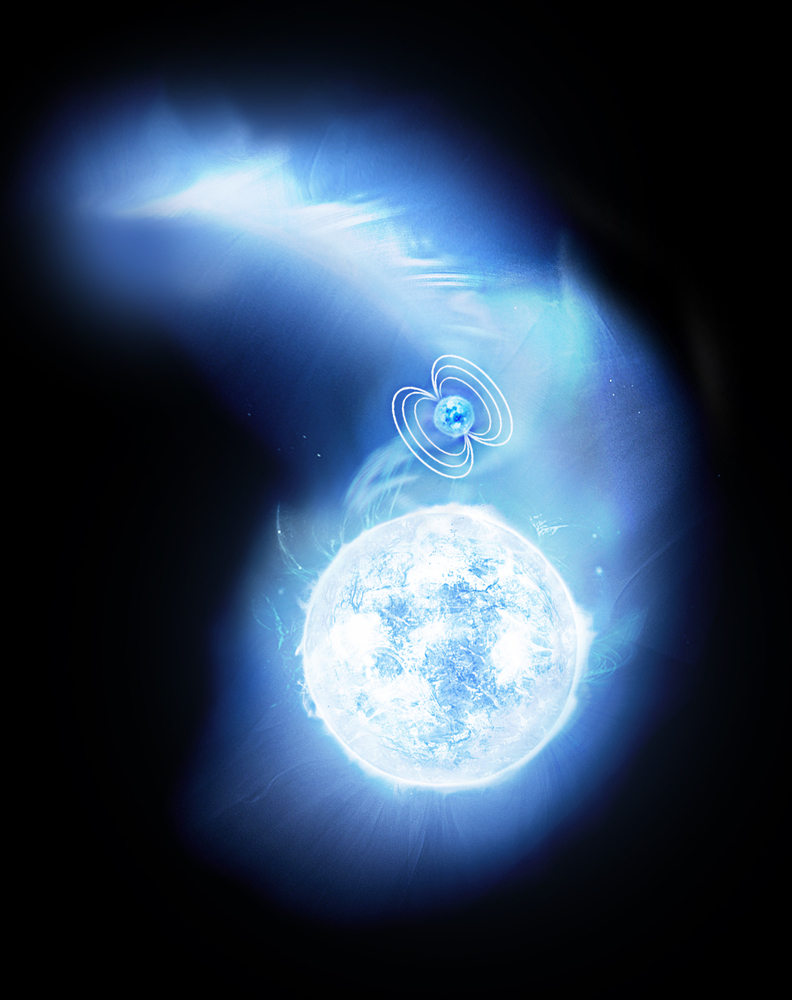
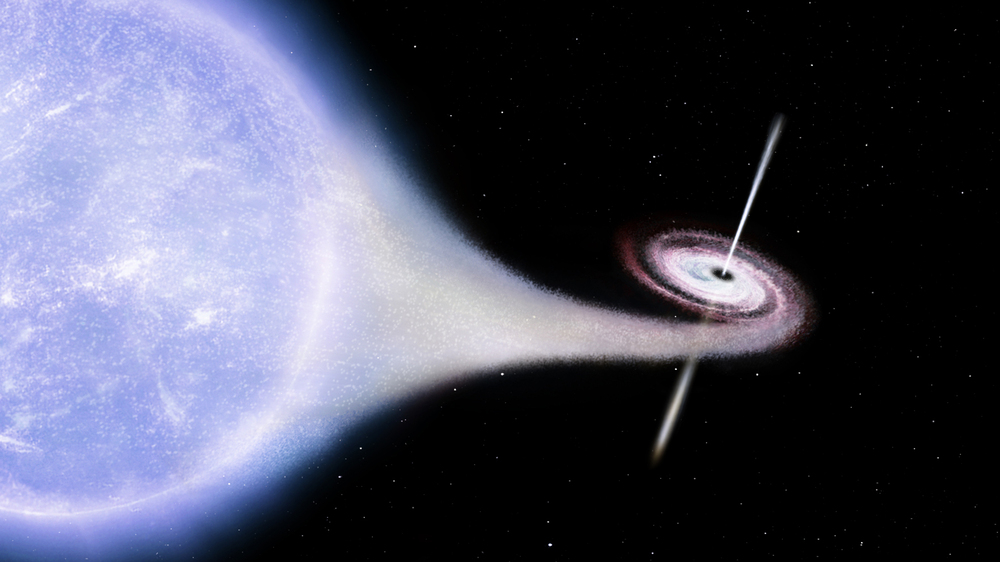
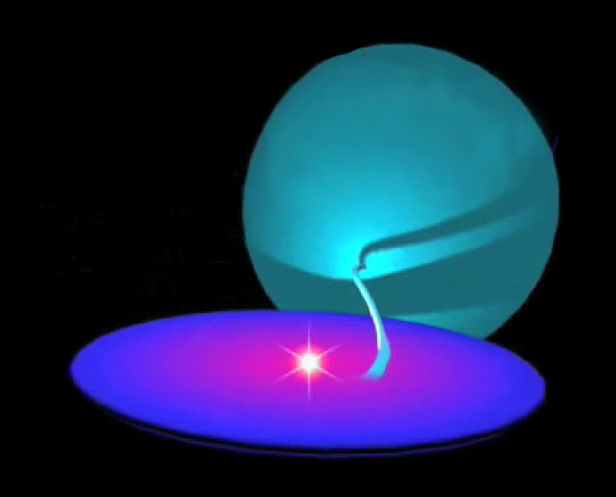
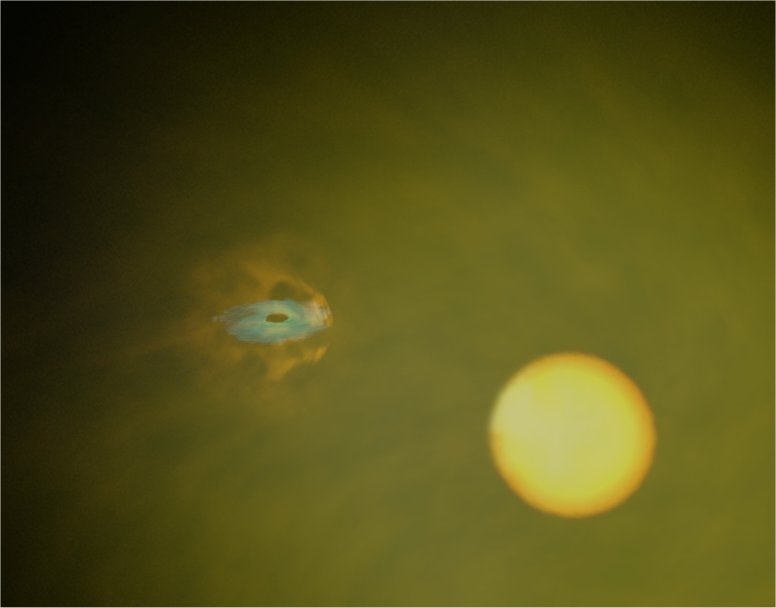
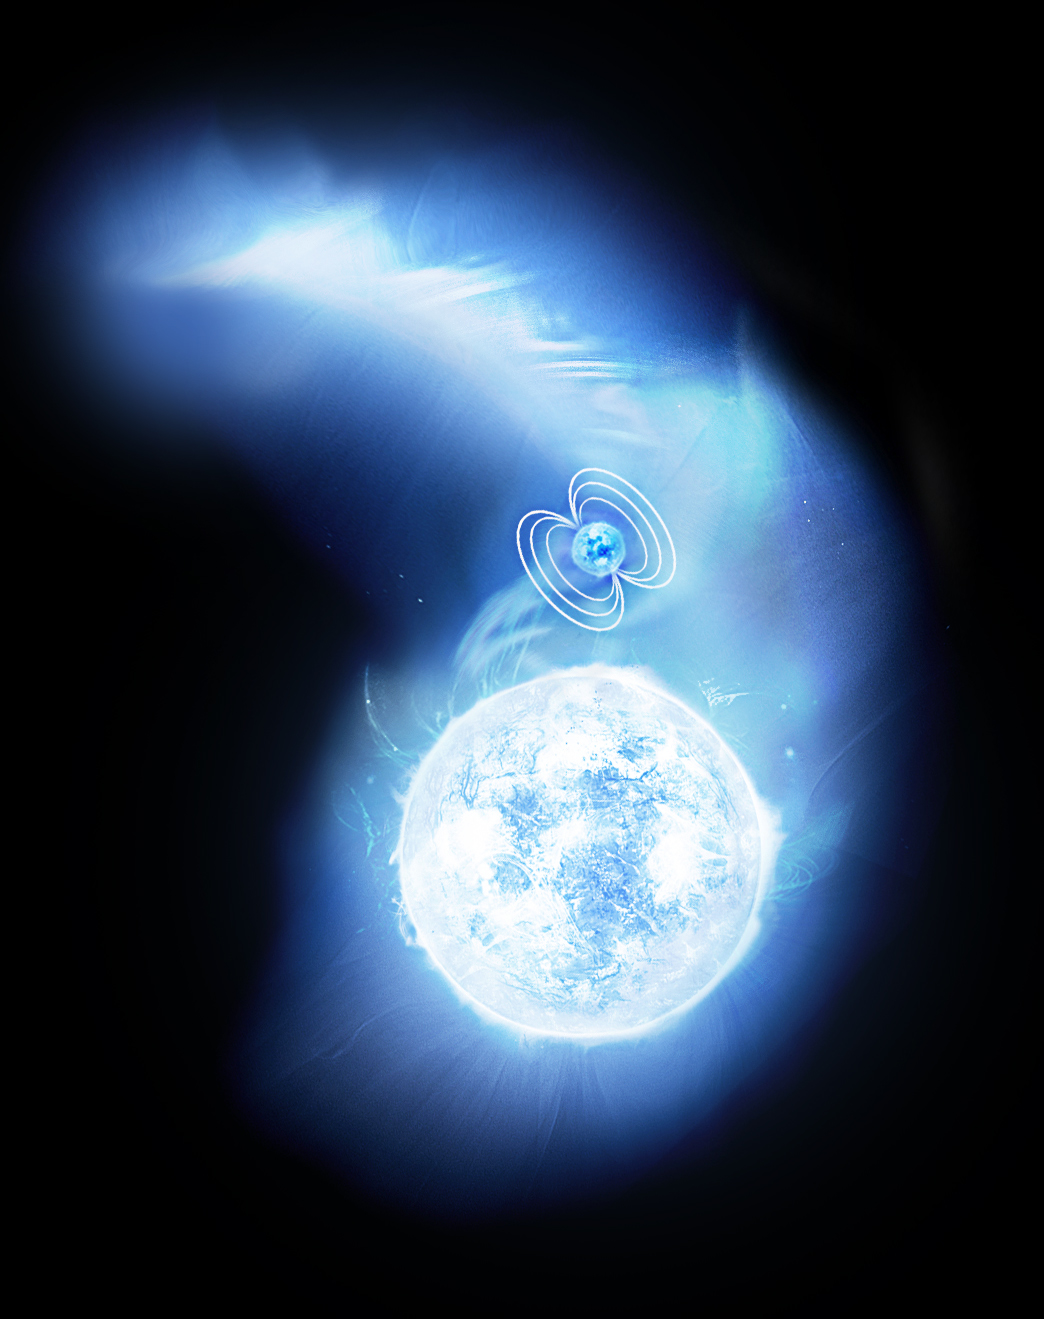
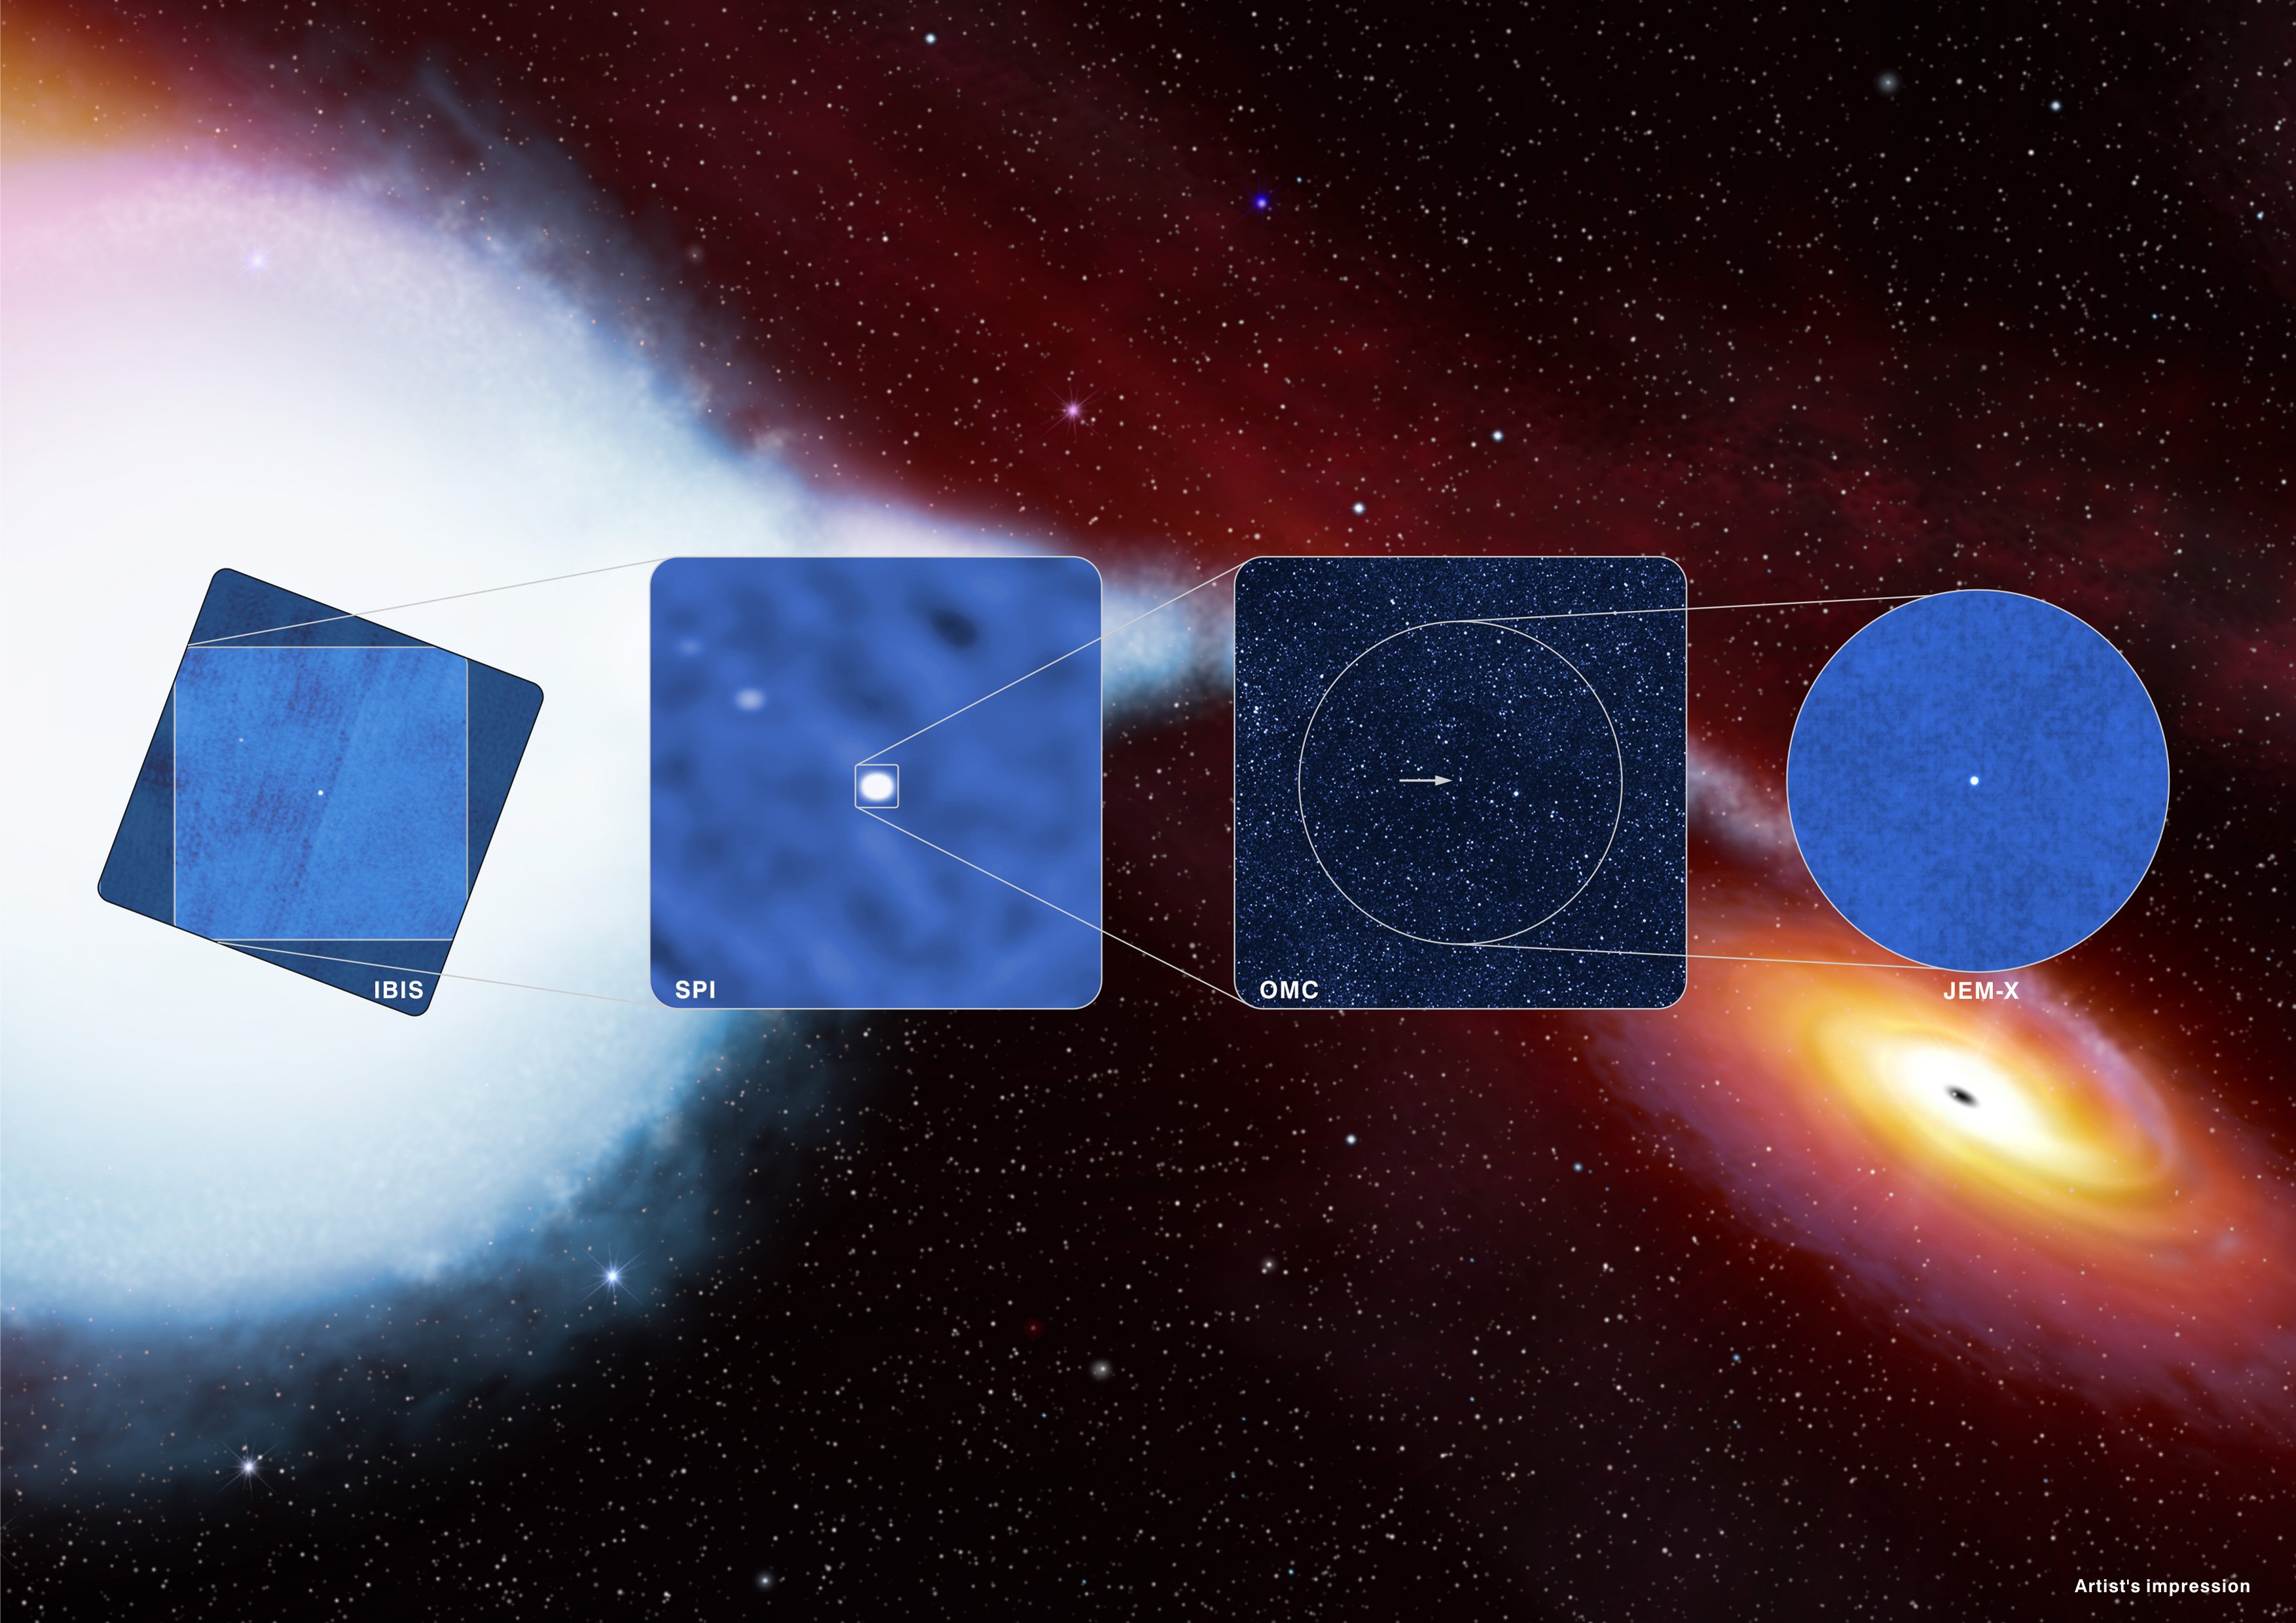
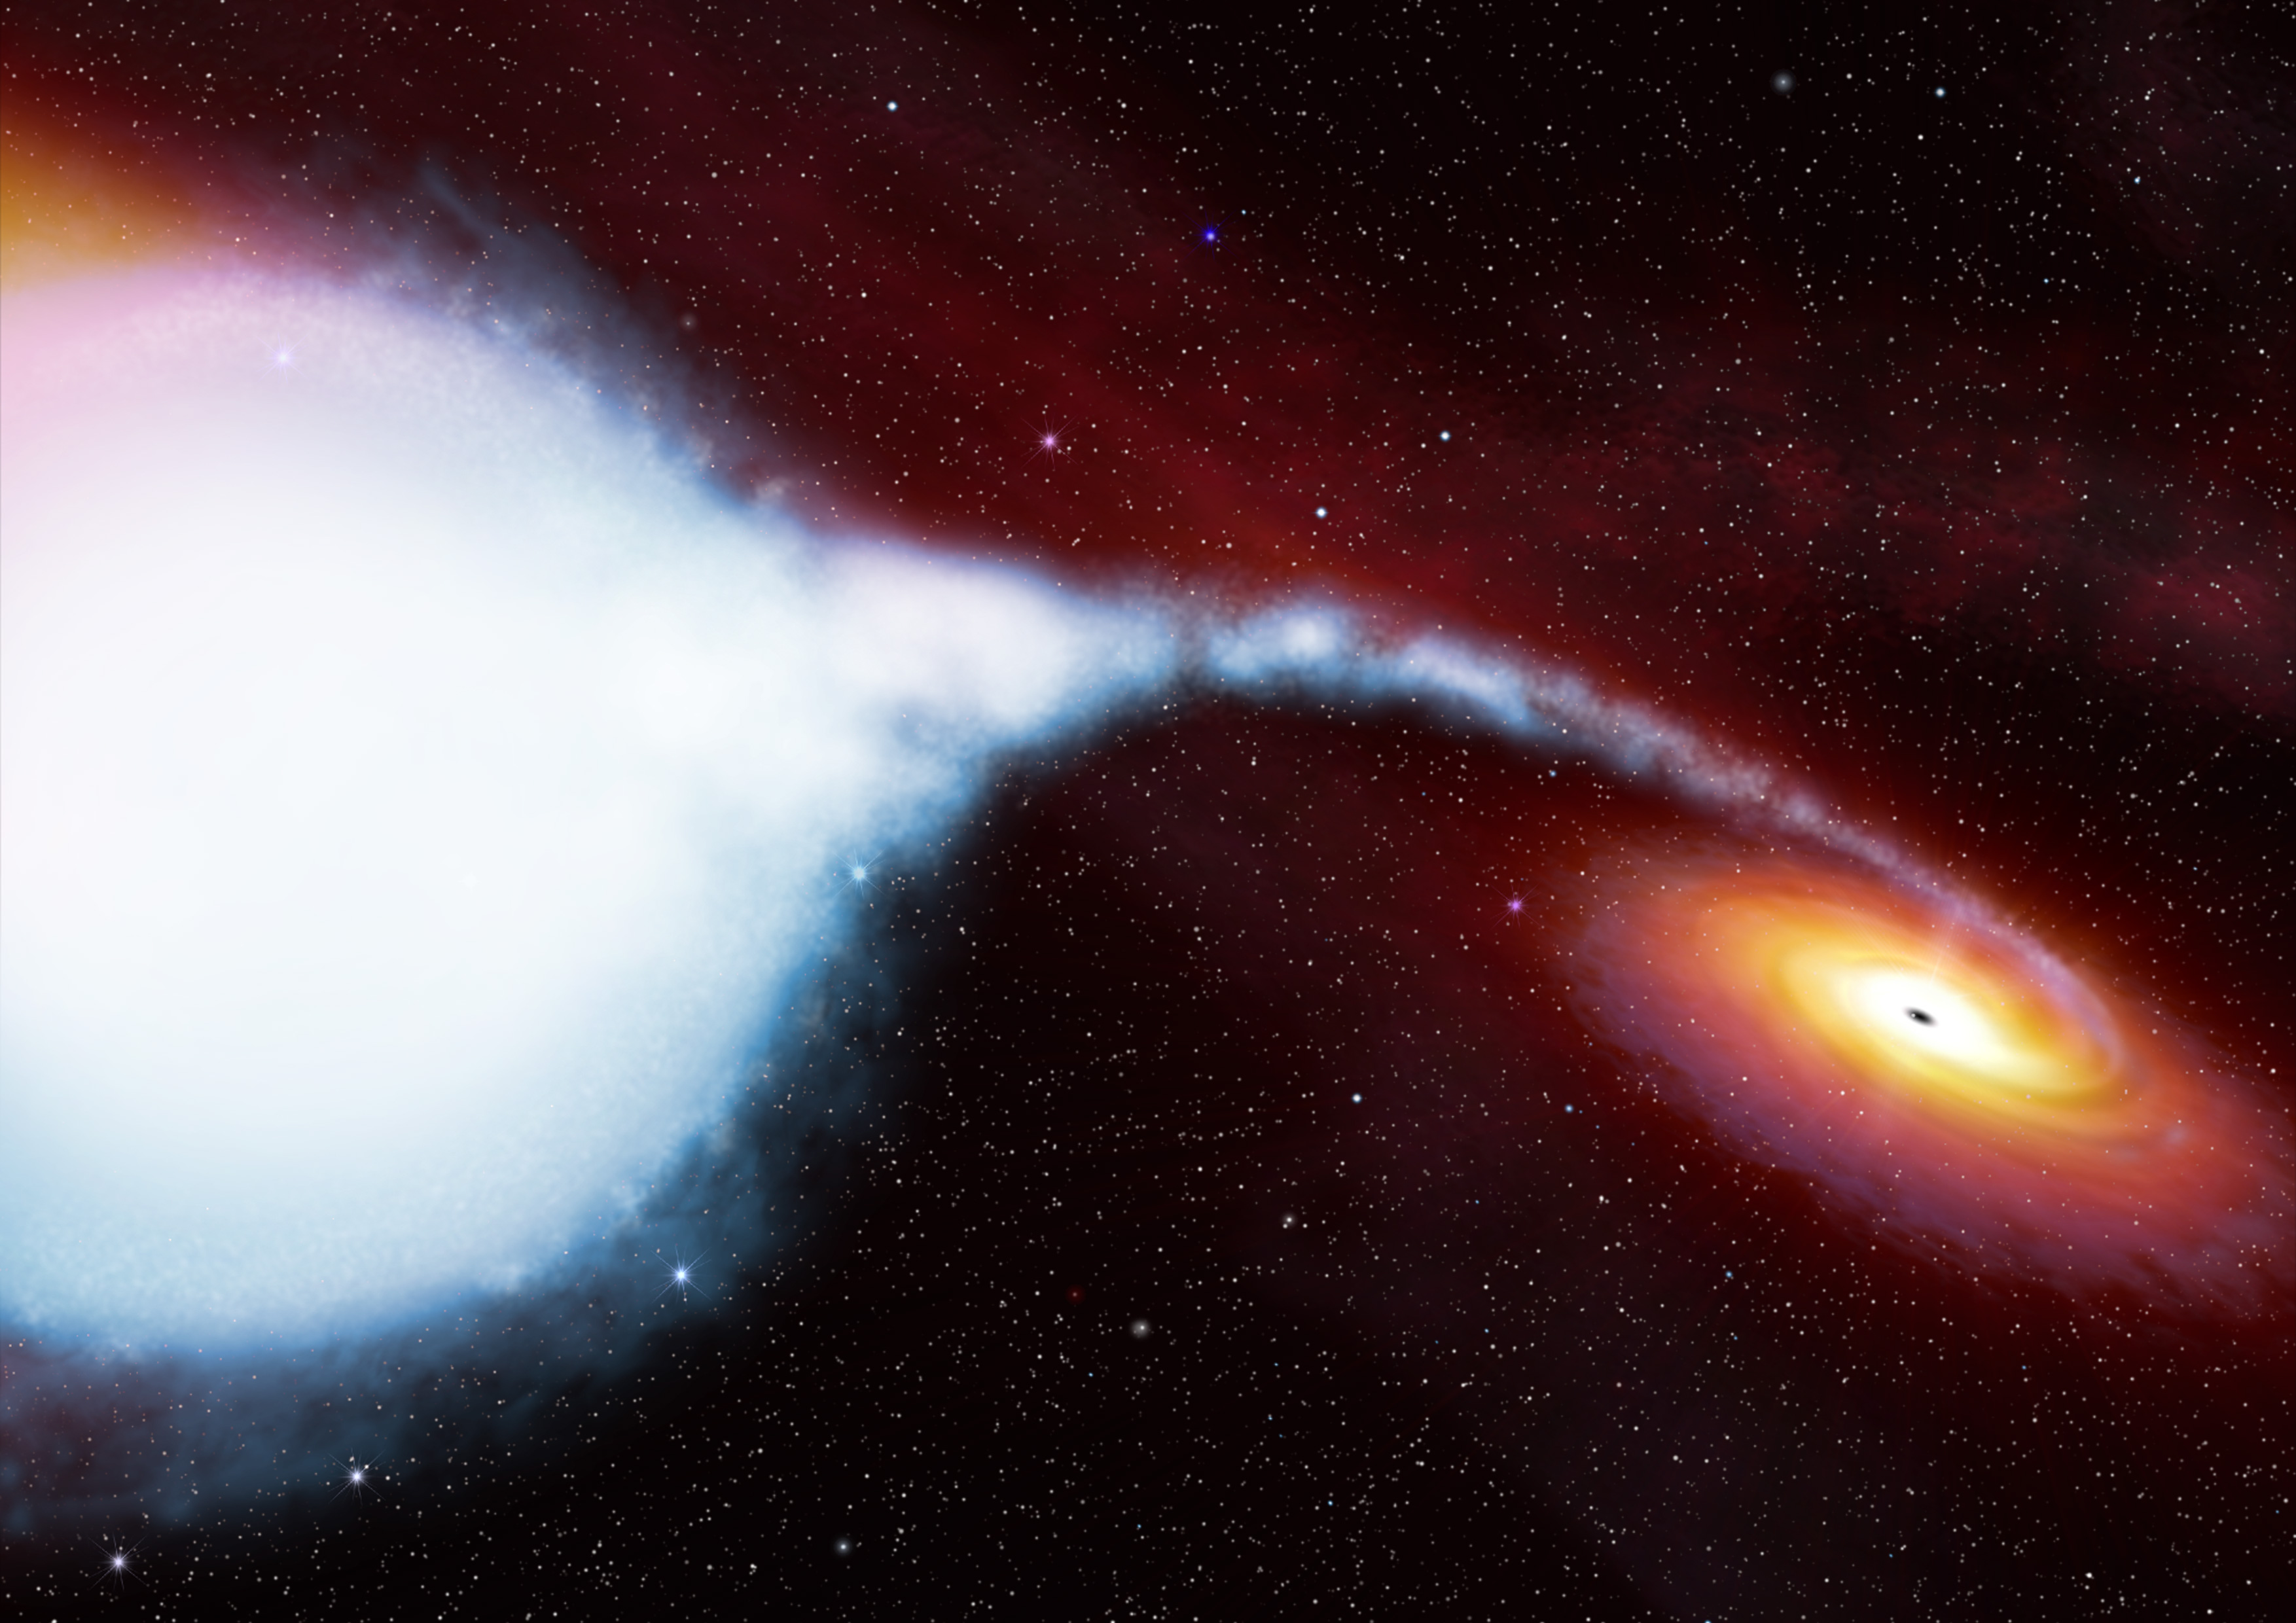
Credits: ESA/AOES Medialab Hi-Res The image shows an artist's impression of the highly obscured high-mass X-ray binary IGR J17252-3616, which consists of a neutron star that is accreting mass from its companion, a blue supergiant star. The gravity of the neutron star funnels and deflects the stellar wind in a thick tail that trails the neutron star. See ESA's Press Release |
 18 OCT 2012
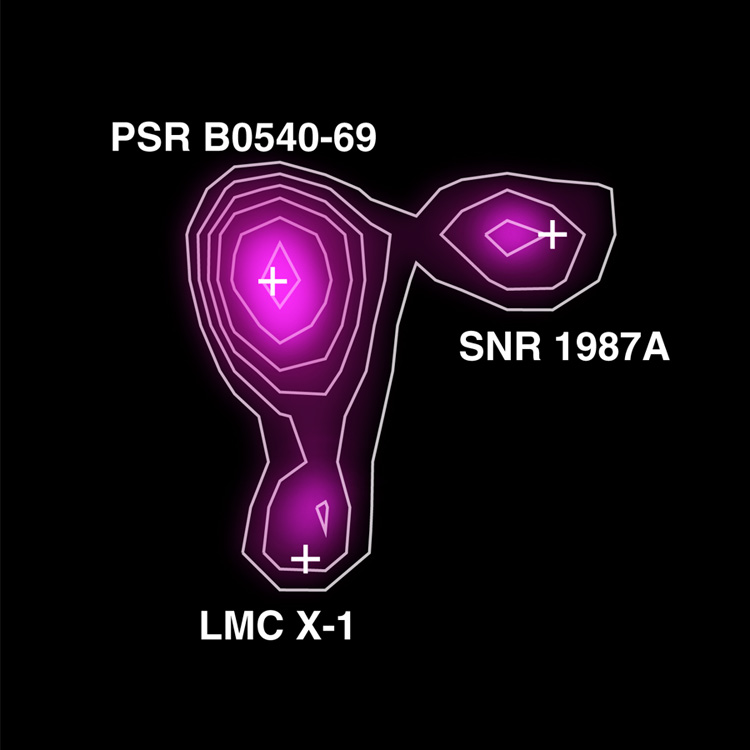
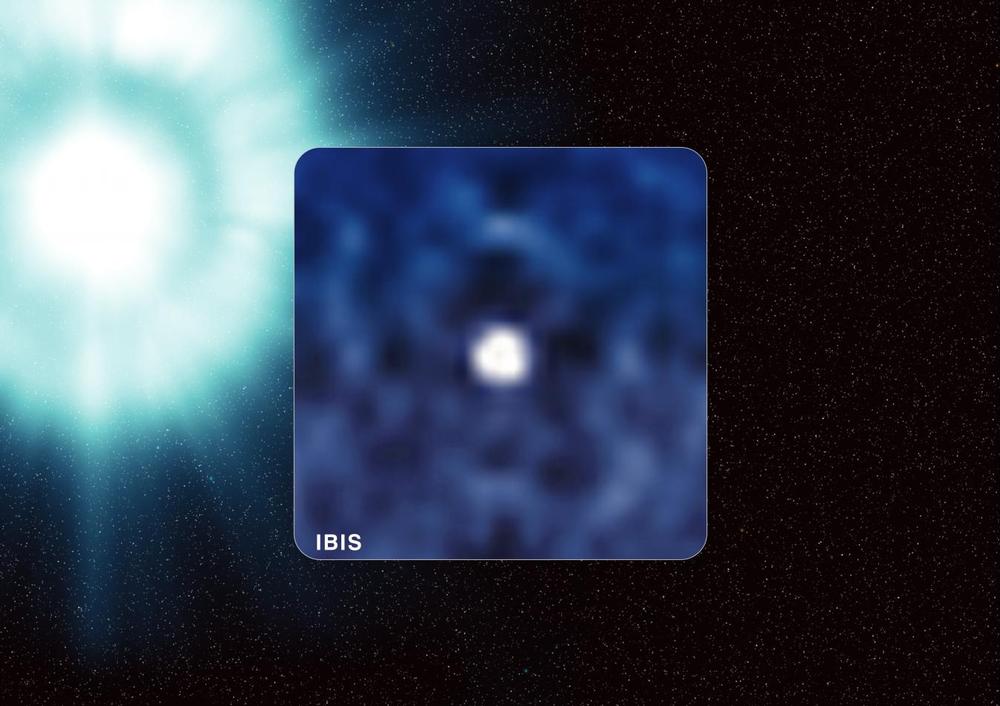
Credits: ESA/Integral/IBIS-ISGRI/S. Grebenev et al. The first detection of titanium-44 in supernova remnant 1987A. INTEGRAL made the detection in the energy range between 65 keV and 82 keV, which brackets two emission lines produced during the decay of titanium-44, at 67.9 keV and 78.4 keV. The emission of the two other sources, the black hole binary LMC X-1 and the pulsar PSR B0540-69 is of different origin. See ESA's Press Release |
 27 SEP 2012
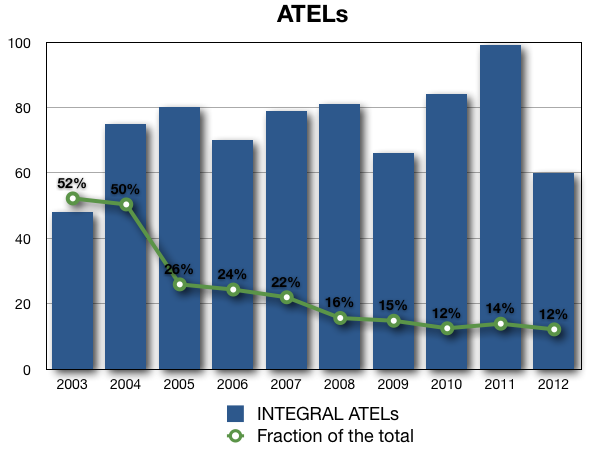
Credits: ISDC/C. Ferrigno Evolution of INTEGRAL ATels over the years in number and in percentage of all ATels. The plot is based on the list of circulars maintained at the ISDC. |
 21 DEC 2011
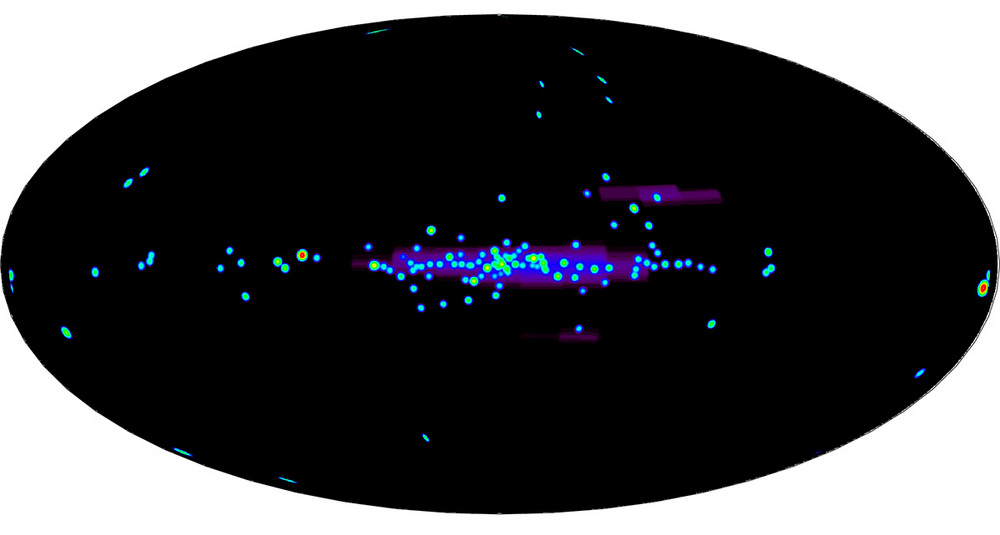
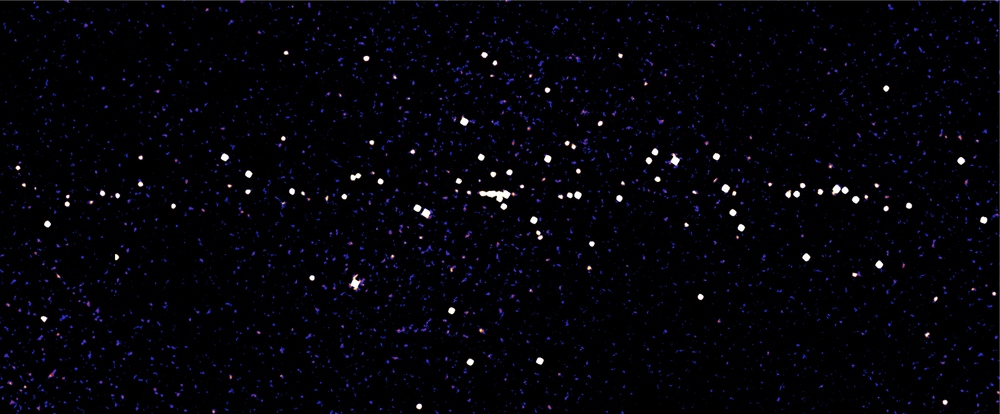
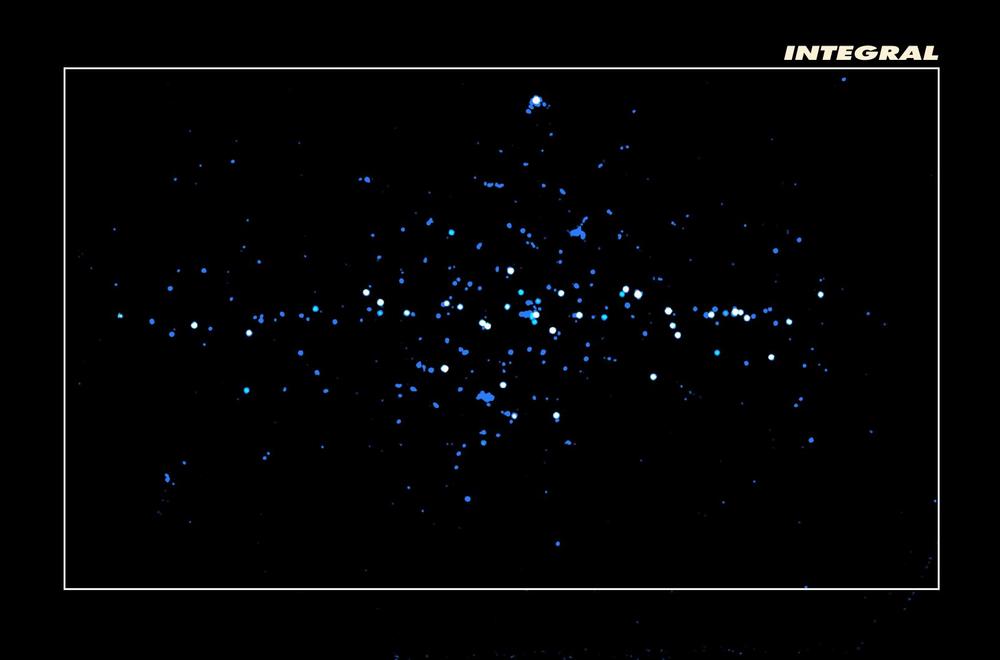
Credits: ESA/INTEGRAL/SPI Hi-Res This image shows the entire sky at hard X-ray energies, between 50 and 100 keV, as observed with the Spectrometer on board INTEGRAL (SPI). The image is based on six years worth of data collected with this instrument. See ESA's Press Release |
 25 MAR 2011
Credits: ESA Hi-Res An artist's impression of the Cygnus X-1 black hole system. Gas from a nearby supergiant star spirals down into the black hole but a small fraction is diverted by magnetic fields into jets that shoot back into space. See ESA's Press Release |
 8 FEB 2011
Credits: ISDC/R. Walter Hi-Res The bulge of the Galaxy in hard X-rays as seen in a deep INTEGRAL exposure. |
 26 NOV 2010
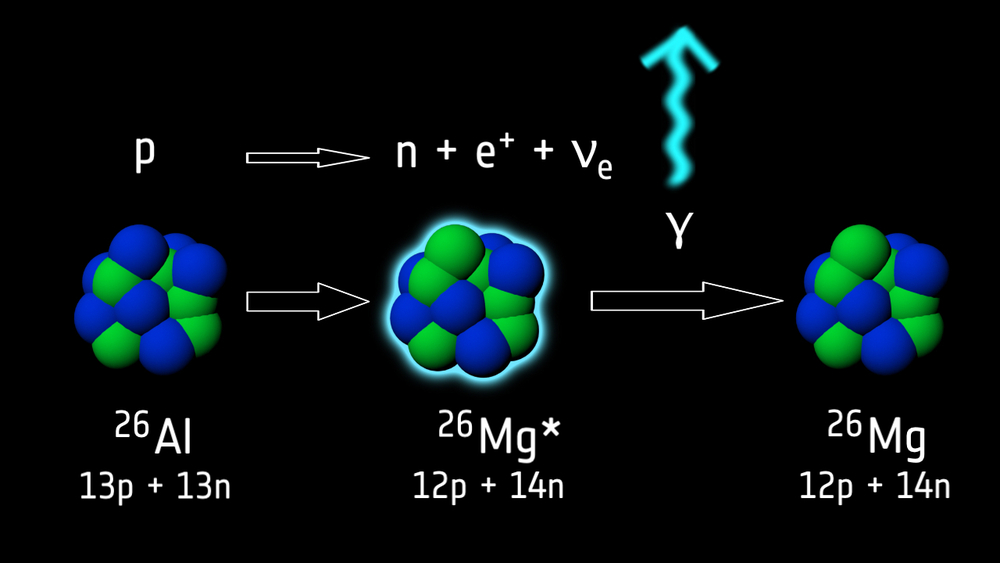
Credits: ESA Hi-Res The radioactive decay process of Aluminum-26 (26Al). Unlike the stable isotope aluminium-27 (27Al), which comprises an extra neutron, 26Al is radioactive and decays with an exponential lifetime of about one million years. The process leads to the emission of an extremely energetic photon, which is observable in gamma rays at an energy of about 1.8 MeV. |
 10 MAR 2010
Credits: ISDC/M. Türler Simulation of INTEGRAL's Earth observation (EO 1) of January 2006. The animation shows a reconstruction of the sky as seen by the IBIS/ISGRI instrument at hard X-ray energies (27.4 keV). It is shown on a logarithmic scale of intensity - increasing from dark and blue to red and bright areas - to reveal the glow of the Earth (blue globe) and the diffuse emission from the sky background (purple) and the galactic ridge (red strip), which are much fainter than the point sources (bright spots). The Earth coordinates (latitudes and longitudes) are overlayed in white with the position of the magnetic pole (circle). The Earth appears to move through the field-of-view and its apparent size decreases as the INTEGRAL spacecraft moves away from the planet on its high-altitude orbit. Publication: Türler et al. 2010 |
 18 AUG 2009
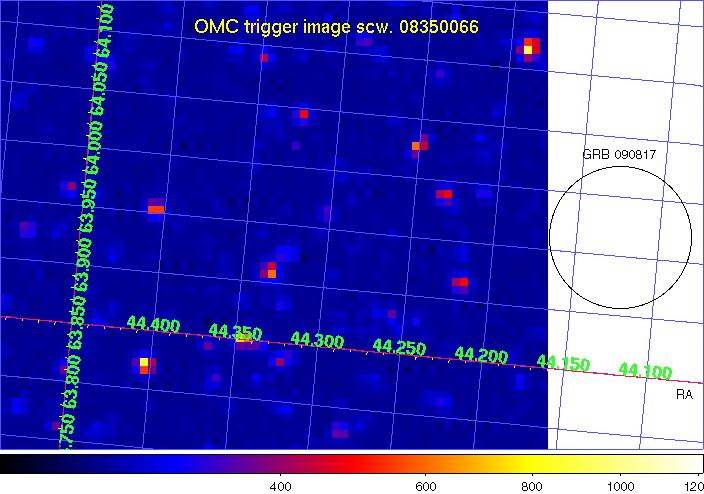
Credits: ISDC/V. Beckmann OMC image taken during GRB 090817, but unfortunately the gamma-ray burst was just outside (see IBIS/ISGRI error circle on the right) the instrument's field of view. |
 18 AUG 2009
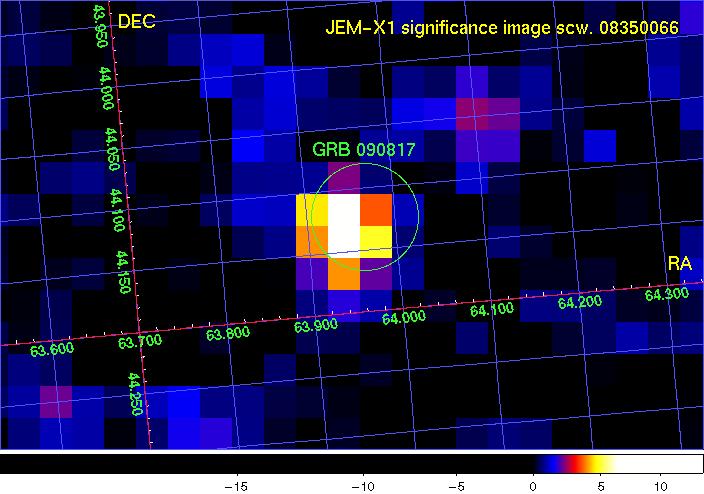
Credits: ISDC/V. Beckmann JEM-X 1 image of GRB 090817 detected near the centre of the INTEGRAL field of view. |
 3 JUL 2009
Credits: ISDC/N. Mowlavi/M. Türler Animation showing the evolution of the INTEGRAL exposure map (IBIS fully coded field-of-view) in steps of 100 spacecraft revolutions (~300 days) up to revolution 800 (~ 6.5 years). The plot covers the whole sky in galactic coordinates. The integration time is color coded according to the scale on the right. Labels show the location of the main targets. |
 3 JUL 2009
Credits: ISDC/N. Mowlavi/M. Türler INTEGRAL exposure map (IBIS fully coded field-of-view) of the whole sky in galactic coordinates for the first 800 revolutions (~ 6.5 years). The integration time is color coded according to the scale on the right. Labels show the location of the main targets. |
 14 NOV 2008
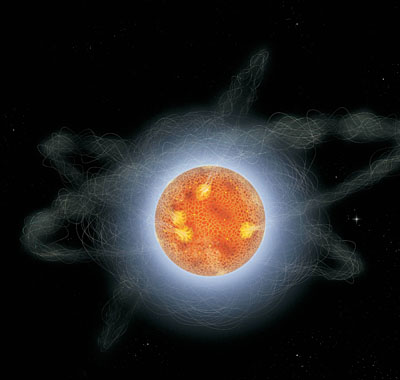
Credits: 2008 Sky & Telescope: Gregg Dinderman Artist's representation of a magnetar, a class of neutron stars with ultra-strong magnetic fields. See ESA's Press Release |
 29 AUG 2008
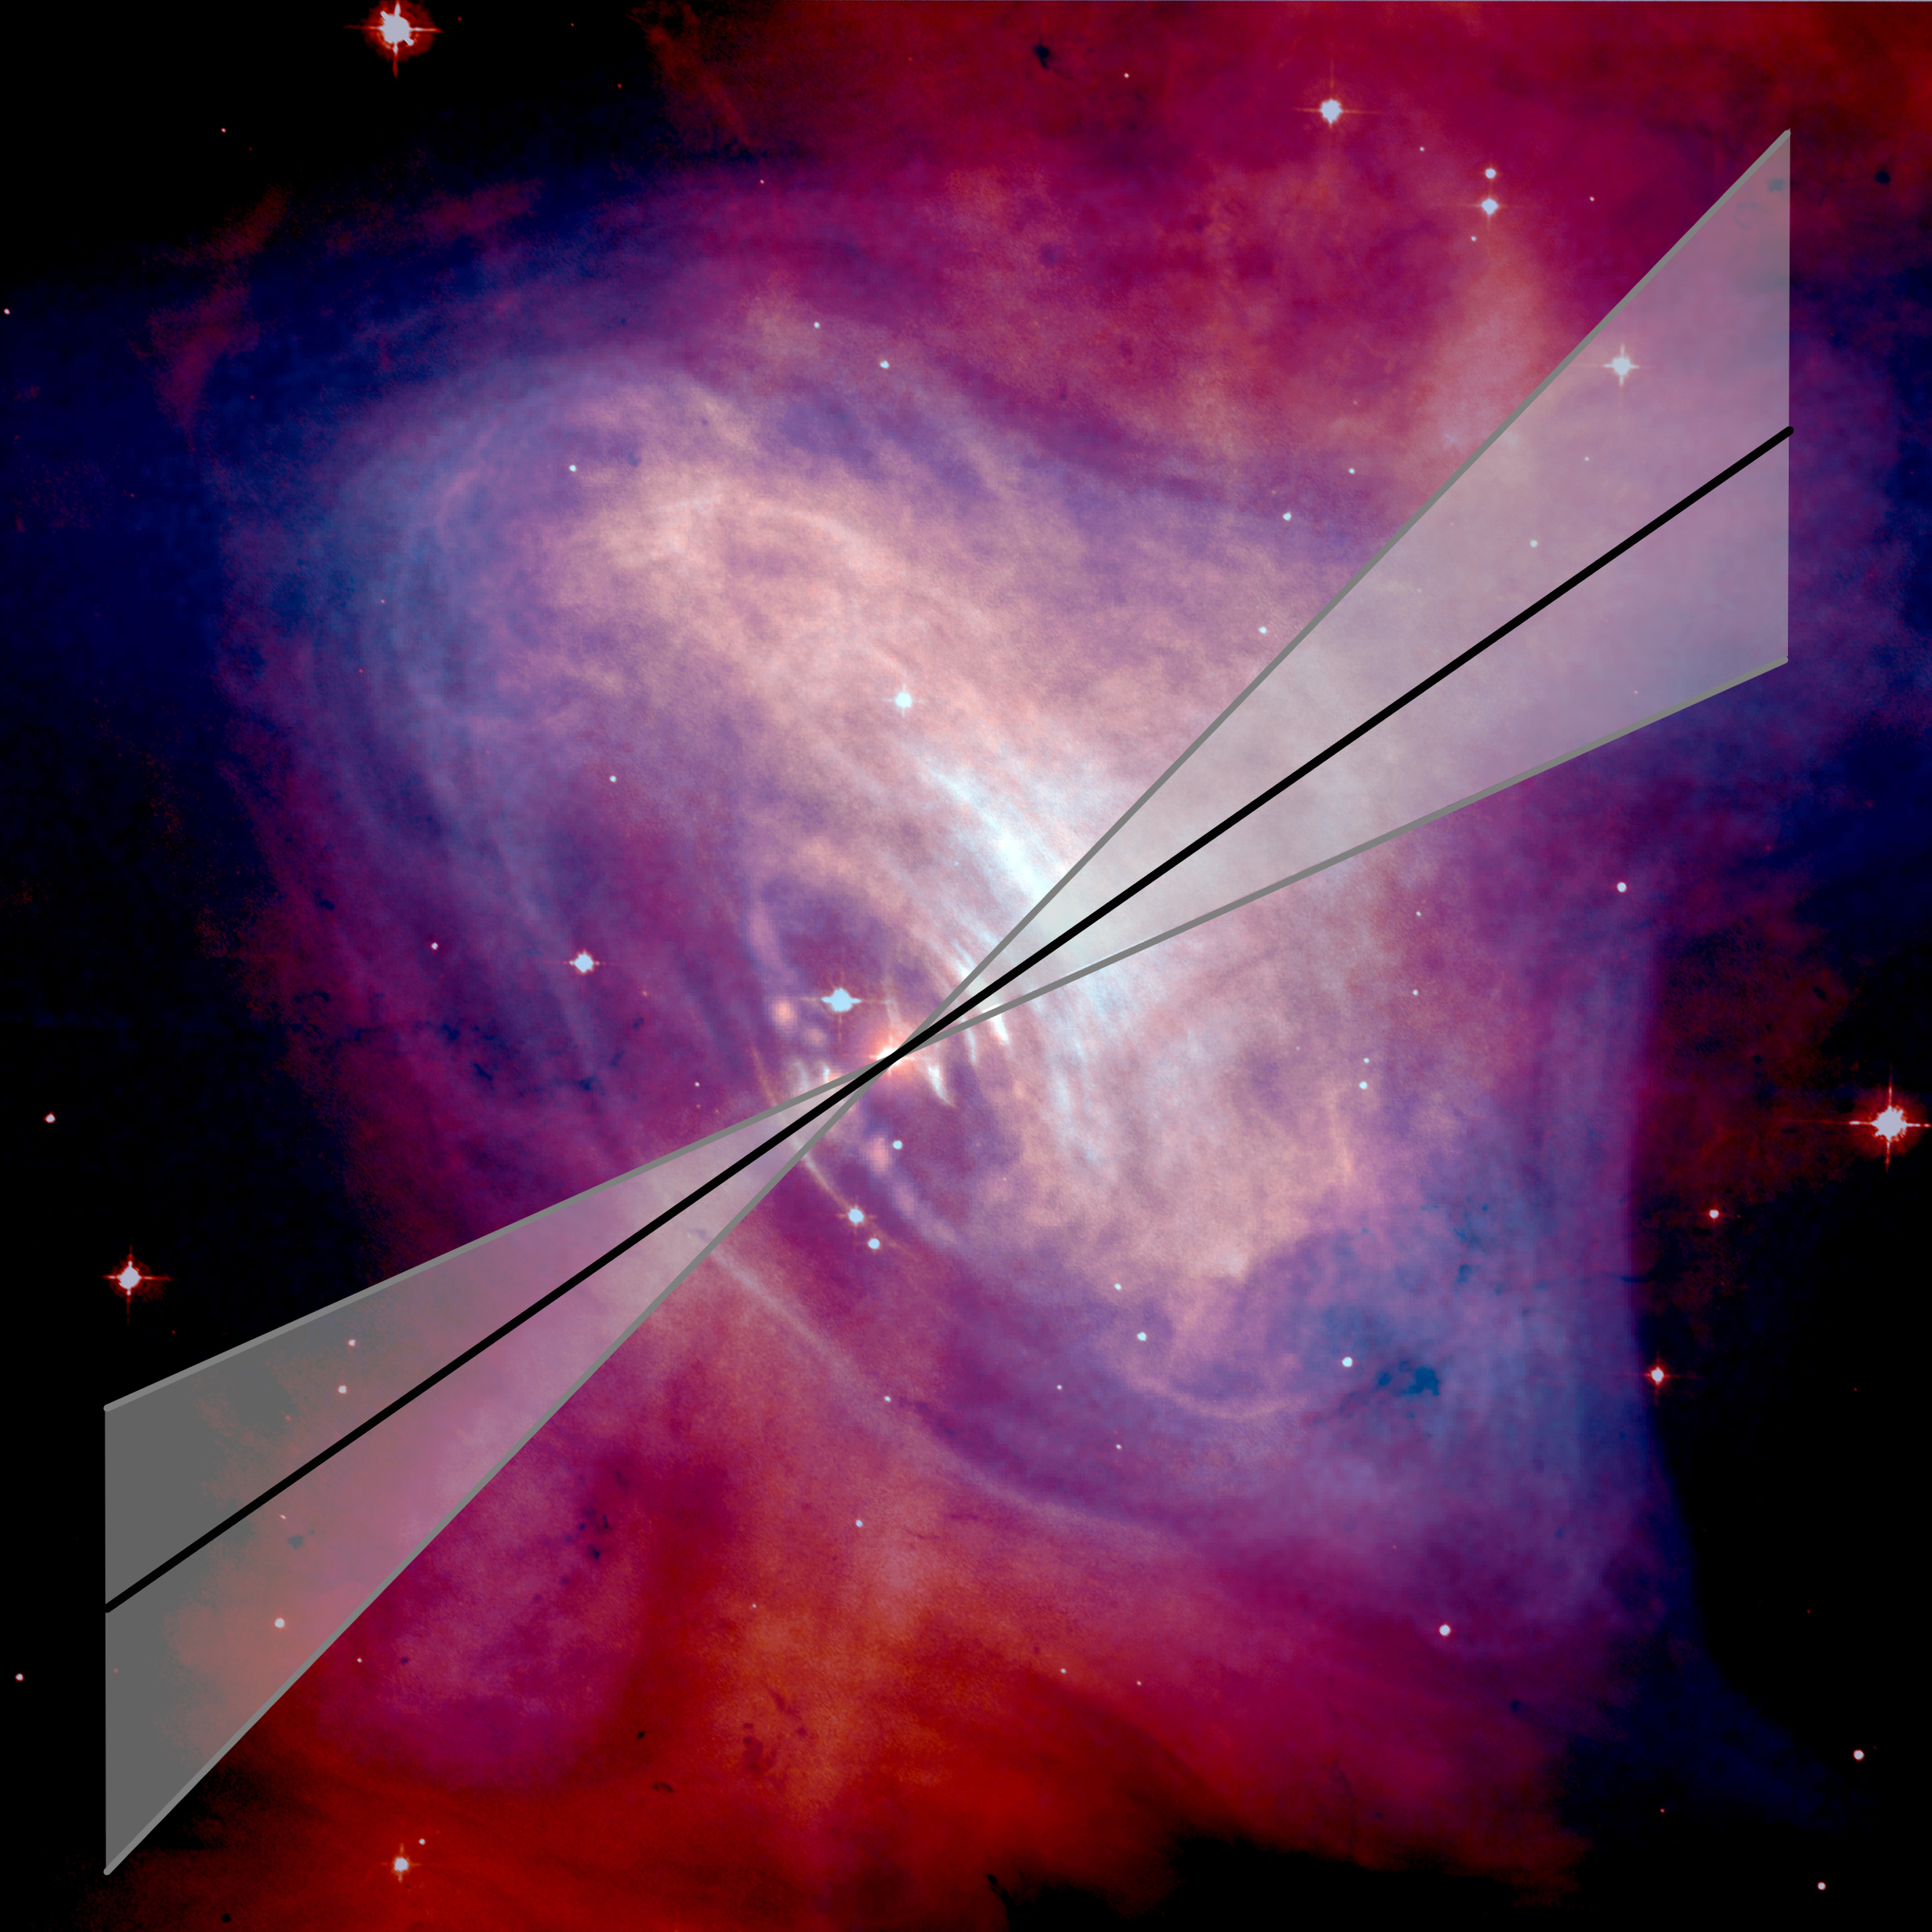
Credits: NASA/ESA/J. Hester et al. Hi-Res This image shows the direction of polarisation (alignement) of the high-energy radiation emitted by the Crab Nebula, as detected by ESA's INTEGRAL gamma-ray observatory. The shaded part represents the error in the determination of this direction. This direction is remarkably aligned with the inner jets of the Crab. On their turn, these are aligned with the rotation axis of the pulsar located at the centre of the system. The Crab Nebula image in the background was obtained by combining an optical image by NASA/ESA's Hubble Space Telescope and an X-ray image by NASA's Chandra X-ray observatory. See ESA's Press Release |
 6 AUG 2008
Credits: ESA/Integral (D. Klochkov) Artist's impression of Hercules X-1 (Her X-1) a prototypical binary system formed by a pulsar (a neutron star) and a low mass companion star. In this system mass flows from the companion onto the neutron star, forming an accretion disk. See ESA's Press Release |
 20 FEB 2008
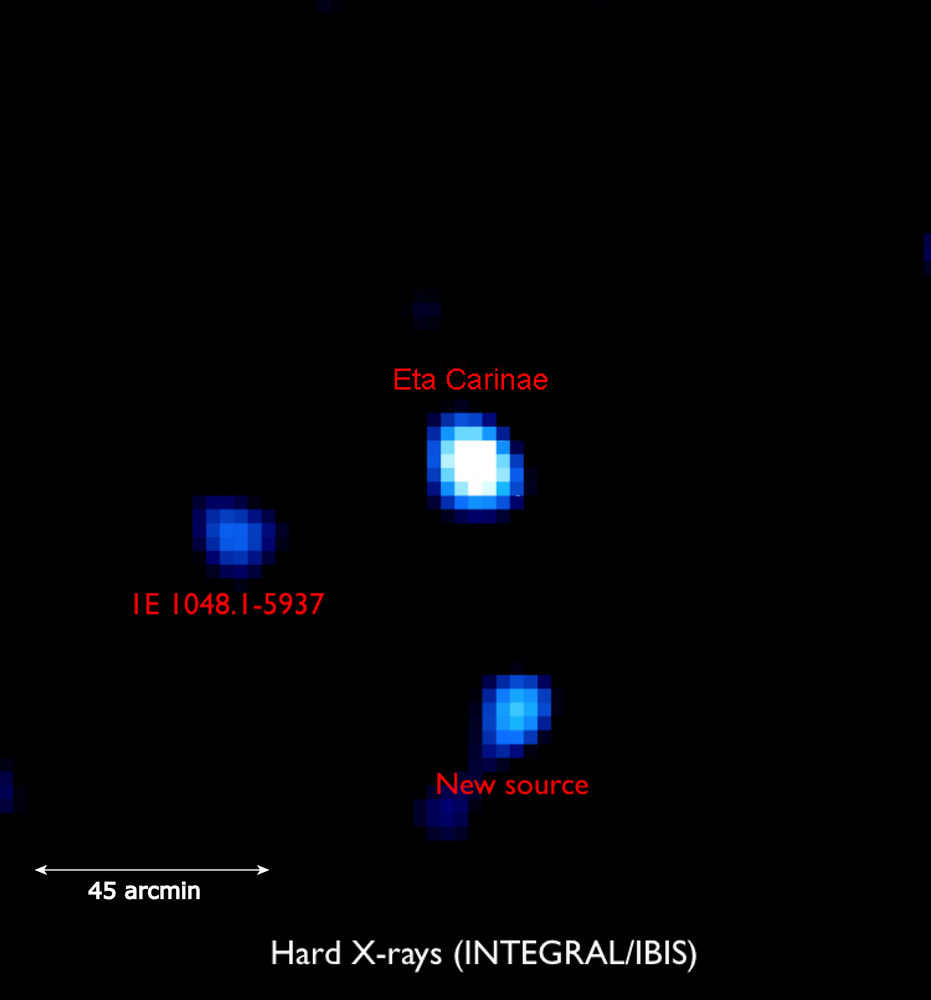
Credits: ESA/Integral (Leyder et al.) Hi-Res Image of the region around Eta Carinae, as seen by the IBIS/ISGRI instrument of INTEGRAL in the high-energy X-ray range. Eta Carina is likely the most massive and brightest star in our galaxy. The radiation observed by INTEGRAL is thought to be due to a shock wave arising when two stars' stellar winds collide, creating a system that is termed a colliding-wind binary. The distance between Eta Carinae and the INTEGRAL point source 1E 1048.1-5937 is 45 arcminutes. See ESA's Press Release |
 10 JAN 2008
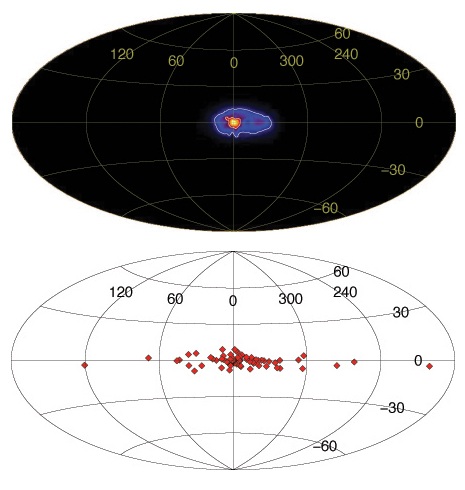
Credits: ESA/Integral/MPE (G. Weidenspointner et al.) The upper panel shows the glow of 511 keV gamma-rays as observed by the spectrometer SPI of INTEGRAL. The 511 keV emission coming from the annihilation of electrons by their antimatter counterparts, the positrons. The map shows the entire sky, with the galactic centre at the middle. The emission can be seen extending towards the right-hand side of the map. The lower panel shows the distribution of low mass X-ray binary stars with a hard X-ray spectrum. This stellar population has a distribution that matches the extent of the 511 keV map. See ESA's Press Release |
 17 DEC 2007
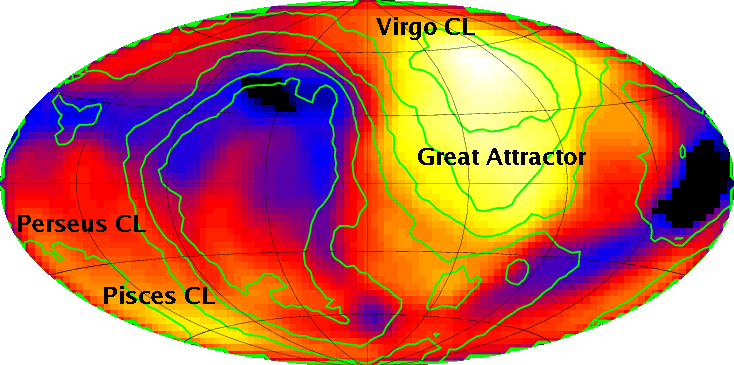
Credits: ESA/Integral/R. Krivonos et al. This INTEGRAL map (celestial sphere in galactic coordinates) shows the projected number density of hard X-ray bright Active Galactic Nuclei (AGNs) in different directions of the sky. The distribution of nearby AGNs is found to be strongly anisotropic and to match well the mass concentrations in the local Universe (green contours) as traced by the "IRAS point source catalogue red-shift survey" at distances smaller than about 230 million light years (70 Mpc). The main excesses in the number density of AGNs observed by INTEGRAL are the highest mass concentrations in the local Universe - the Virgo cluster and the Great Attractor, as well as the Perseus-Pisces supercluster. See ESA's Press Release |
 9 NOV 2007
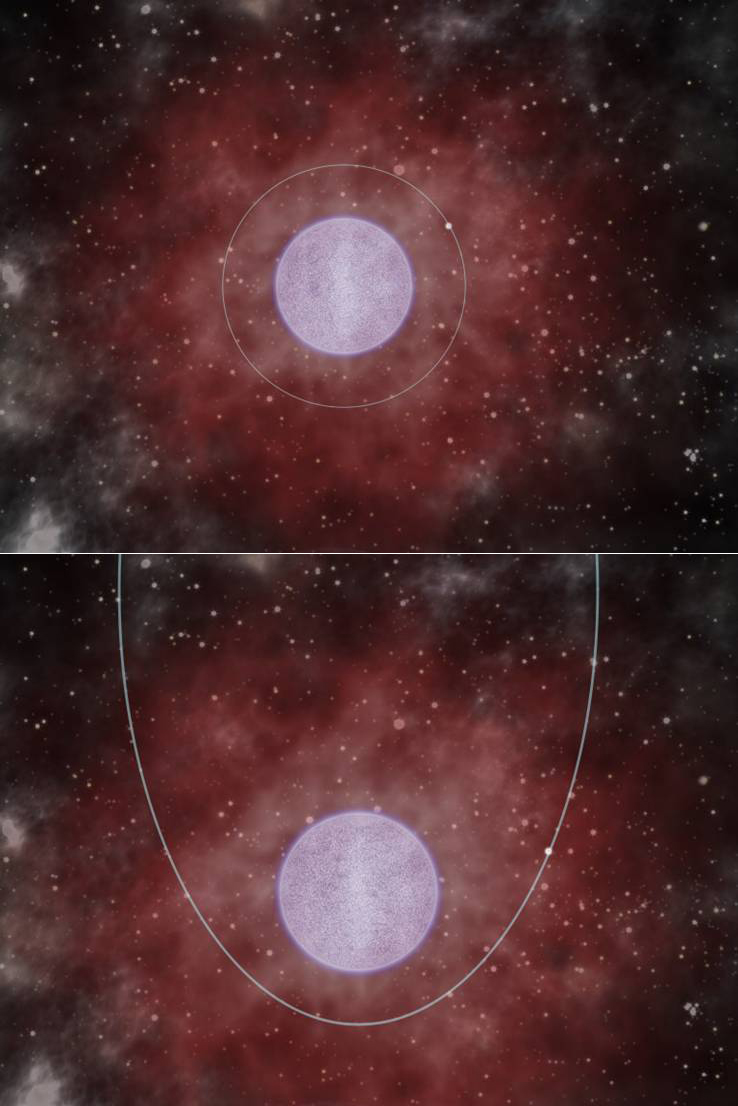
Credits: University of Paris/S. Chaty Hi-Res This is an artist's impression of INTEGRAL's investigation of high-mass X-ray binaries. Integral has revealed two different types of stars. In the first example (top panel), the neutron star companion is buried deeply in the extended outer envelope of the star. This results in persistent X-ray emission. In the second example (bottom panel), the neutron star only occasionally swallows material from the envelope, causing a sudden brightening of its gamma-ray emission. |
 9 NOV 2007
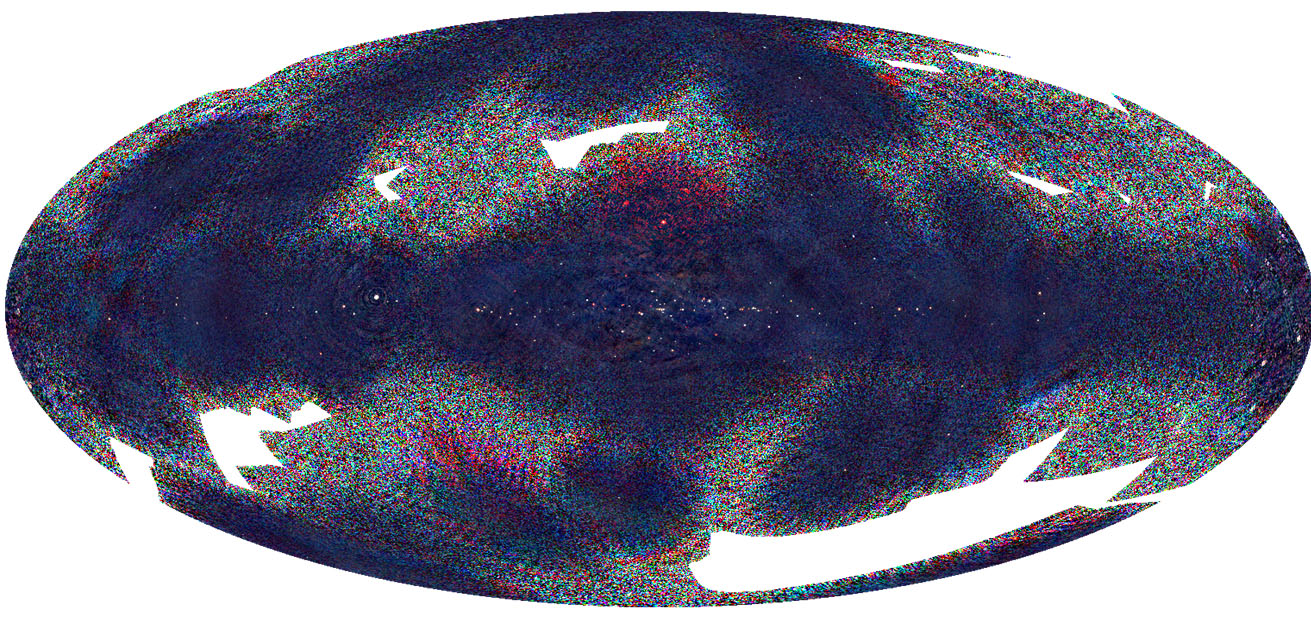
Credits: ESA/INTEGRAL/IBIS Survey Team Hi-Res This image shows the soft gamma-ray sky, as revealed by INTEGRAL during its first five years of operation. Soft gamma-rays have energies somewhere between 20-100 keV. Most sources of celestial gamma-rays in the Universe emit in this region of the gamma-ray spectrum. This image is a mosaic of data taken with the Imager on Board the Integral Satellite (IBIS). |
 27 SEP 2007
Credits: ISDC/N. Mowlavi/M. Türler Animation showing the evolution of the INTEGRAL exposure map (IBIS fully coded field-of-view) in steps of 100 spacecraft revolutions (~300 days) up to revolution 600 (~ 5 years). The plot covers the whole sky in galactic coordinates. The integration time is color coded according to the scale on the right. Labels show the location of the main targets. |
 27 SEP 2007
Credits: ISDC/N. Mowlavi/M. Türler INTEGRAL exposure map (IBIS fully coded field-of-view) of the whole sky in galactic coordinates for the first 600 revolutions (~ 5 years). The integration time is color coded according to the scale on the right. Labels show the location of the main targets. |
 3 MAY 2007
Credits: X-rays: ISDC/A. Bodaghee/R. Walter; Optical: A. Mellinger Hi-Res Combined optical and gamma-ray image animation of the central part of the Milky Way. The deep INTEGRAL IBIS/ISGRI hard X-ray mosaic image of the galactic bulge region has been colored in pink and superimposed onto the optical image from A. Mellinger. |
 3 MAY 2007
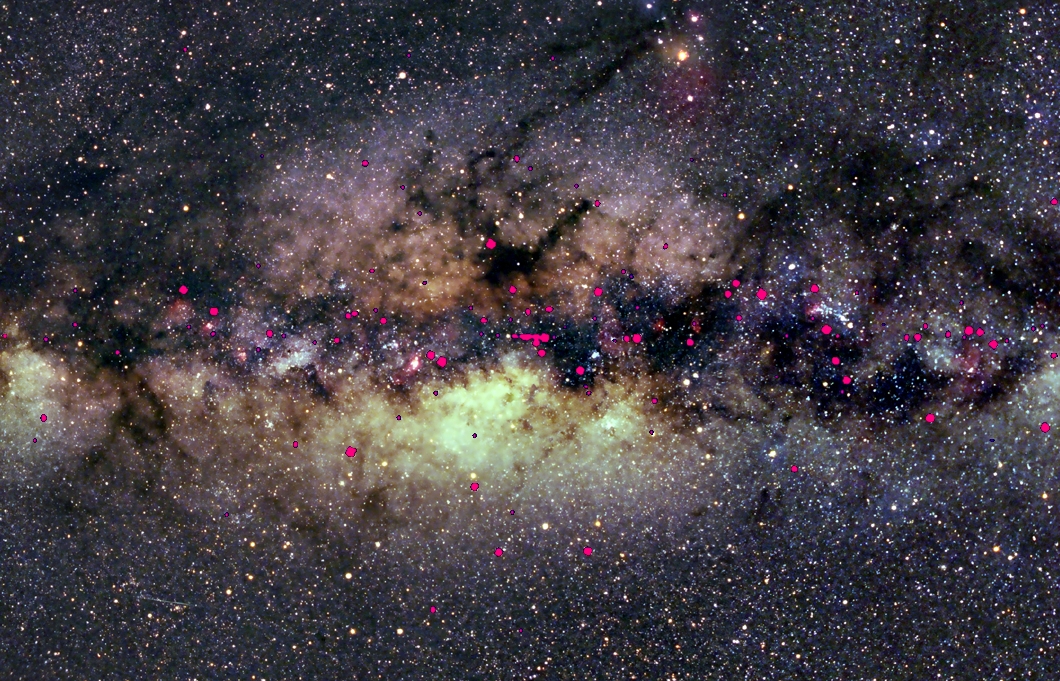
Credits: X-rays: ISDC/A. Bodaghee/R. Walter; Optical: A. Mellinger Hi-Res Combined optical and gamma-ray image of the central part of the Milky Way. The deep INTEGRAL IBIS/ISGRI hard X-ray mosaic image of the galactic bulge region has been colored in pink and superimposed onto the optical image from A. Mellinger. |
 23 APR 2007
Credits: A. Bodaghee & R. Walter (ISDC, Geneva) This animation of a region of the galactic plane between on the left, the galactic centre and on the right the Norma Arm (a spiral arm in our galaxy, the Milky Way) shows how the gamma-ray sky varies during 5 successive observation periods (GCD1a: 2003-01-29 to 2003-03-15; GCDE 1b: 2003-03-15 to 2003-04-17; GCDE 2a: 2003-08-02 to 2003-08-19; GCDE 2b: 2003-08-19 to 2003-10-08; GCDE 3a: 2004-02-16 to 2004-03-17). The animation is repeated twice, once without source labels and once with source labels. The images are derived from IBIS/ISGRI mosaics of the significance map in the 30-50 keV band and cover an area of about 30 x 10 degrees. Most of the sources were discovered by INTEGRAL and are probably members of the class of highly-absorbed X-ray binaries typically found in the spiral arms of the Milky Way. |
 2 FEB 2007
Credits: ISDC/N. Mowlavi/M. Türler INTEGRAL exposure map (IBIS fully coded field-of-view) of the whole sky in galactic coordinates for the 500 first revolutions. The integration time is color coded according to the scale on the right. The main targets are labeled. |
 22 JAN 2007
Credits: ESA/ISDC Hi-Res Animation of INTEGRAL observations of the Galactic Centre from February 2005 to April 2006 as part of the Galactic bulge monitoring campaign. The images have been taken by the IBIS/ISGRI instrument on board INTEGRAL in the 20-60 keV band and covers a sky area of 5.3x4.1 degrees, centred on the Galactic Centre. Note that the medium and high-resolution images contain more individual frames. See ESA's Press Release Publication: Kuulkers et al., 2007, astro-ph/0701244 |
 22 JAN 2007
Credits: ESA/ISDC The Galactic Centre in a very quiet state in April 2006 from the data of the Galactic bulge monitoring campaign. The image has been taken by the IBIS/ISGRI instrument on board INTEGRAL in the 20-60 keV band and covers a sky area of 4.3x2 degrees centred on (0, -0.5) degrees in Galactic coordinates. The sources and the positions marked in white are almost permanently visible, while those marked in red are known 'transient' sources, that is sources more often 'off' than 'on'. The massive black hole at the very centre of our Galaxy, Sagittarius A* (or Sgr A*), is very close to source marked as '1', corresponding to IGR J17456-2901. |
 22 JAN 2007
Credits: ESA/ISDC Average view of the Galactic Centre from February 2005 to April 2006 with the data of the Galactic bulge monitoring campaign. The image has been taken by the IBIS/ISGRI instrument on board INTEGRAL in the 20-60 keV band and covers a sky area of 4.3x2 degrees centred on (0, -0.5) degrees in Galactic coordinates. The sources and the positions marked in white are almost permanently visible, while those marked in red are known 'transient' sources, that is sources more often 'off' than 'on'. The massive black hole at the very centre of our Galaxy, Sagittarius A* (or Sgr A*), is very close to source marked as '1', corresponding to IGR J17456-2901. |
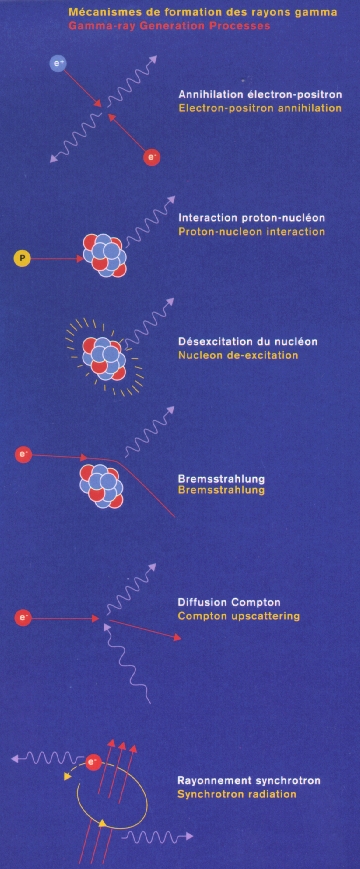 27 OCT 2006
Credits: ESA Schematic representation of various gamma-ray generation processes. [ This image was scanned from the back of the INTEGRAL poster produced by ESA. ] |
 7 SEP 2006
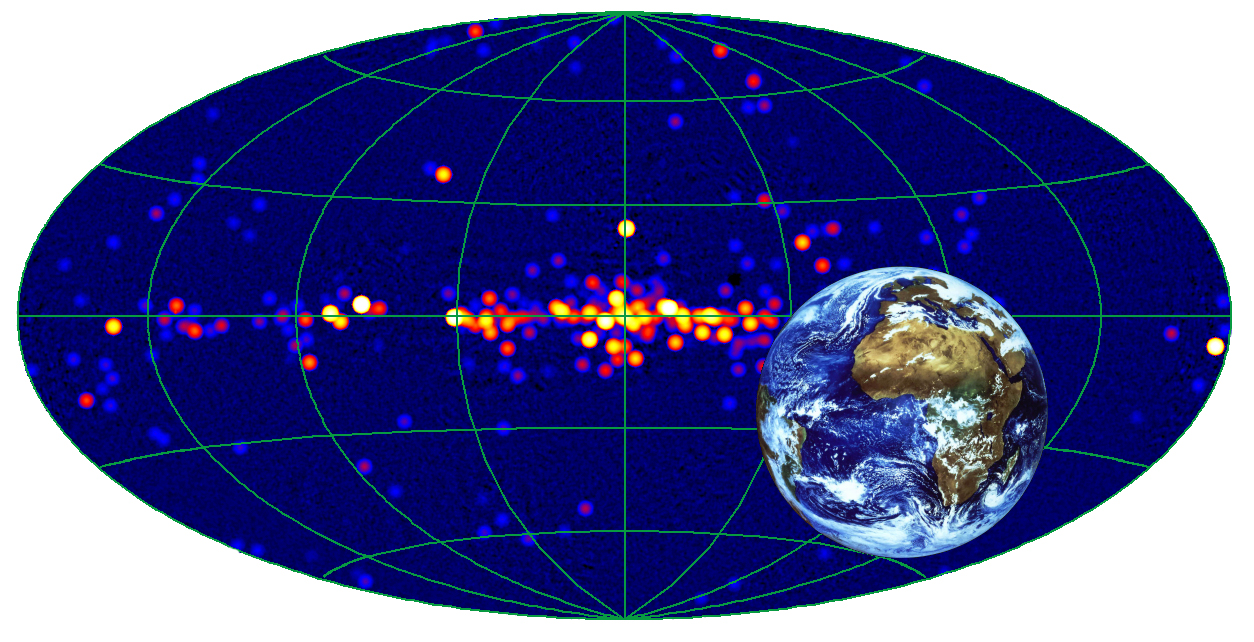
Credits: ESA/IKI Integral team Earth image by ESA/EUMETSAT superposed on an all-sky hard X-ray image obtained using most images taken by INTEGRAL during its first four years of operations. The sources were artificially blurred and the colour map was stretched to make both strong and weak sources readily visible. The concentration of sources along the mid plane of the image is due to neutron stars and stellar mass black holes in our Galaxy, while the majority of sources located far away from the Galactic plane are super-massive black holes in other galaxies. The Cosmic X-ray Background (CXB) is composed from the emission of tens of millions of similar objects much further away from us. The CXB was measured by INTEGRAL using the Earth as a shield to block the emission from the population of distant black holes. For clarity, the Earth as shown here covers a bigger area of the sky as during actual INTEGRAL observations performed in January-February 2006. See ESA's Press Release Publication: Churazov et al. 2006, A&A, astro-ph/0608250 |
 26 JUL 2006
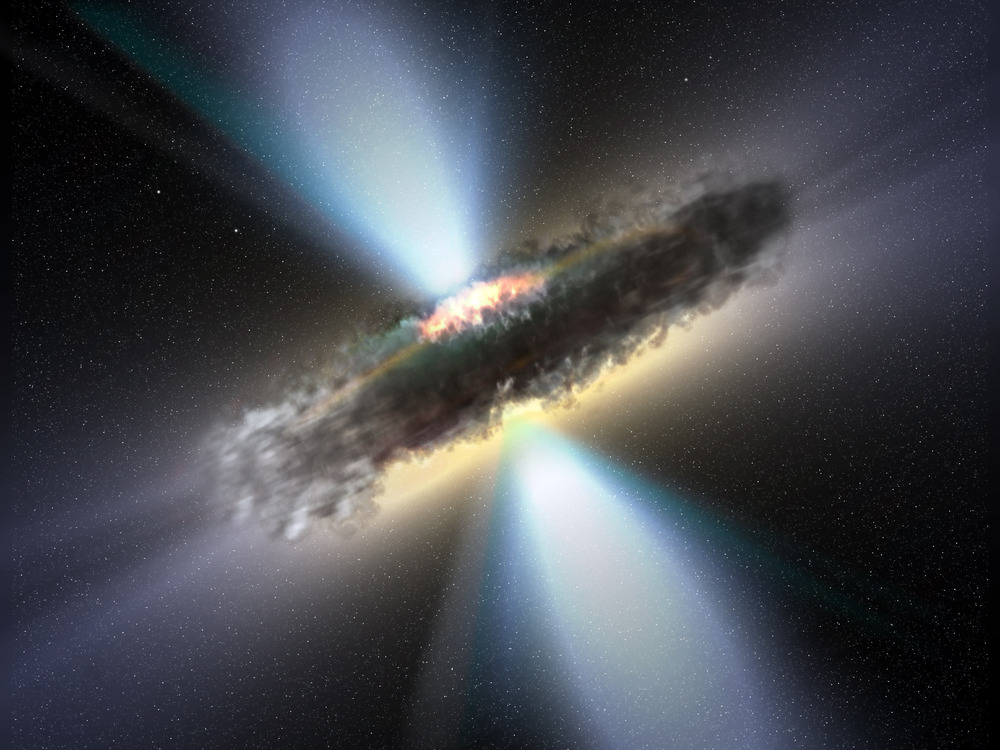
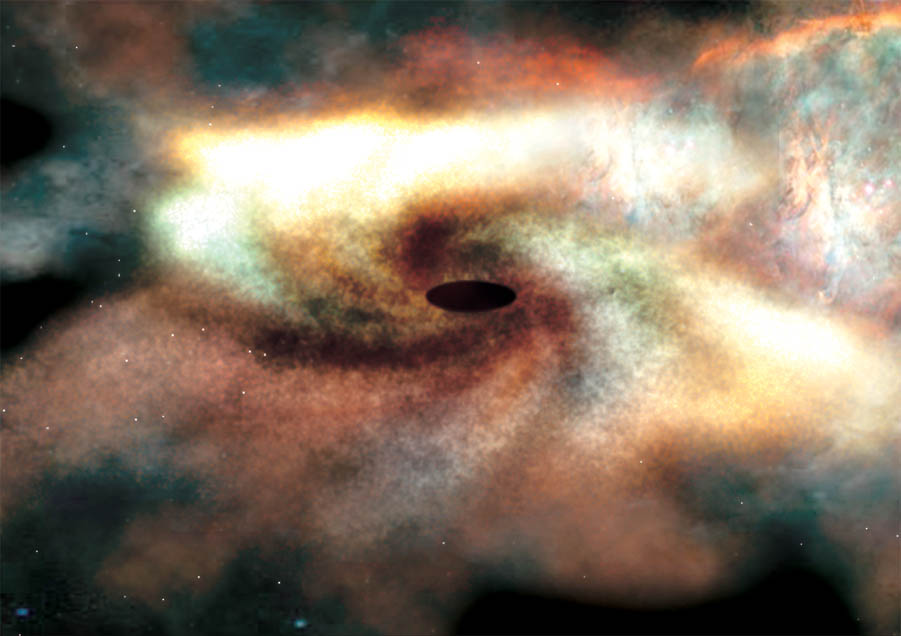
Credits: ESA / V. Beckmann (NASA-GSFC) Hi-Res This illustration shows the thick dust torus that astronomers believe surrounds supermassive black holes and their accretion discs. When the torus is seen edge-on as in this case, much of the light emitted by the accretion disc is blocked. However, the sharp X-ray and gamma-ray eyes of INTEGRAL can peer through the thick dust and locate "hidden" black holes. INTEGRAL's survey of the local universe searched for hidden black holes but found few, which implies these kinds of black holes are largely in the more distant (earlier) universe. See Press Releases by ESA, NASA and UMBC Publication: Beckmann et al. 2006, ApJ, astro-ph/0606687 |
 26 JUL 2006
Credits: D. Finkbeiner (hydrogen) / ESA, INTEGRAL, V. Beckmann, NASA-GSFC (gamma ray) This all-sky map shows regions of ionized hydrogen gas in the local universe. The hidden black holes detected in the INTEGRAL survey of high-energy X-ray sources are located within the diamond-shape marks. Many sources were detected through the line of sight of the dusty Milky Way galactic plane, which is the bright area stretching across the center of the entire image from left to right. See Press Releases by ESA, NASA and UMBC Publication: Beckmann et al. 2006, ApJ, astro-ph/0606687 |
 28 MAR 2006
Credits: ISDC/N. Mowlavi/M. Türler INTEGRAL exposure map (IBIS fully coded field-of-view) of the whole sky in galactic coordinates for the 400 first revolutions. The integration time is color coded according to the scale on the right. The main targets are labeled. |
 16 MAR 2006
Credits: ESA Hi-Res This artist's impression shows an anomalous X-ray pulsar, a class of spinning neutron stars observed by ESA's INTEGRAL gamma-ray observatory. INTEGRAL has detected a pulsed `hard tail' emission of high-energy (`hard') X-rays and gamma-rays in the radiation of several of such pulsars. This emission implies an extremely high magnetic field a thousand million times stronger than the strongest steady magnetic field achievable in a laboratory on Earth. See ESA's Press Release |
 07 FEB 2006
Credits: ISDC (M. Türler et al.1) Simulation of the first INTEGRAL Earth observation on 24-25 January 2006. The animation shows the passage of the Earth through the IBIS/ISGRI field of view. It takes into account the decreasing exposure outside of the fully coded field-of-view (the central square). The Earth is occulting the cosmic X-ray background (CXB) and the galactic X-ray point sources (bright spots), but its atmosphere is also emitting X-rays both through reflection of the CXB and through interaction of cosmic rays. The resulting lightcurve (dotted line) - constructed by summing all pixels in the image - corresponds well to what is observed by ISGRI around 30-40 keV. The UTC time corresponding to each frame is given in the upper right of the image. Data and additional information are available at Science News. 1 M. Türler, M. Chernyakova, A. Neronov, N. Produit, R. Walter, D. Willis |
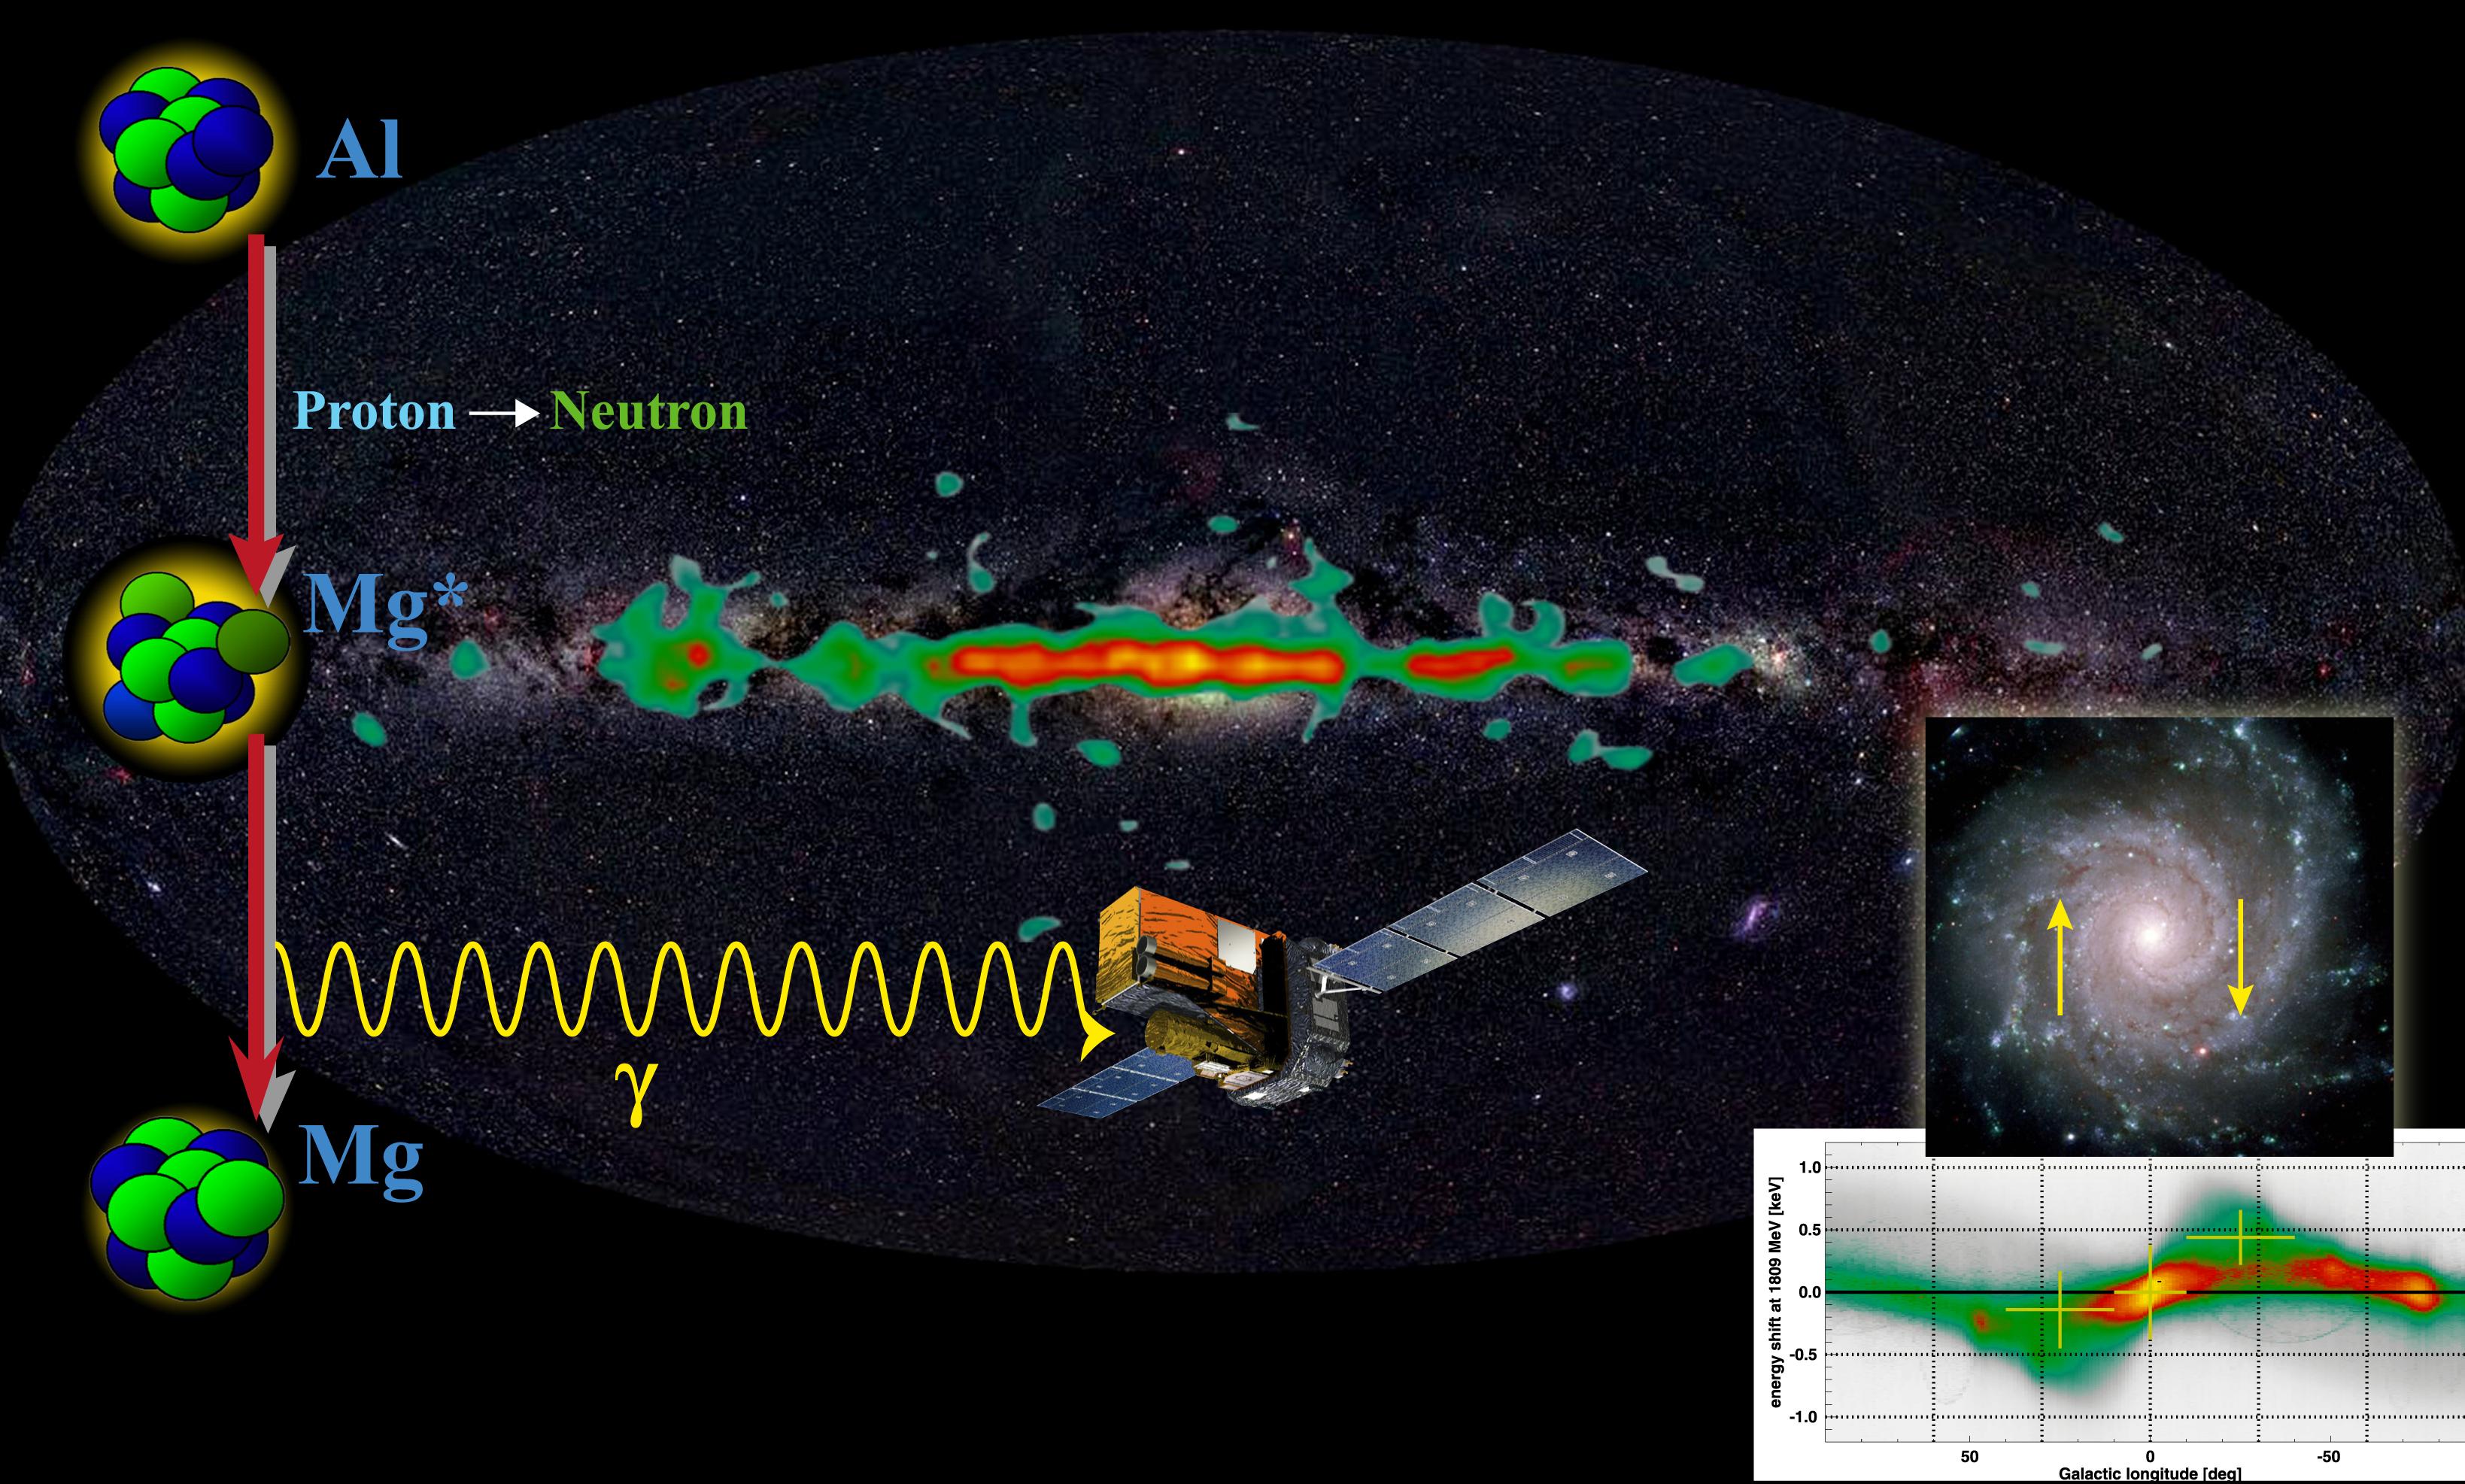
 5 JAN 2006
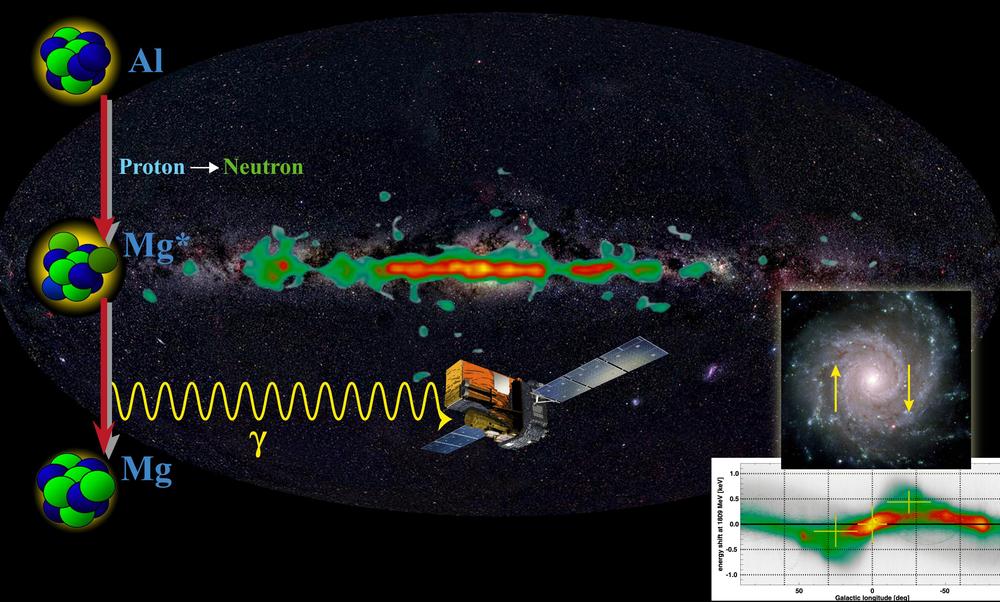
Credits: MPE Hi-Res Shematic view of the radioactive decay of Al 26 to Mg as measured by INTEGRAL in gamma-rays. The background image of the Milky Way in visible light is overlaid with the Compton-GRO/COMPTEL false color map of Al 26 emission. The lower right inset shows the energy shift of the characteristic Al 26 emission line due to Galactic rotation. See ESA's press release Publication: Diehl et al. 2006, Nature 439, 45 (PDF [158 K]) |
 5 JAN 2006
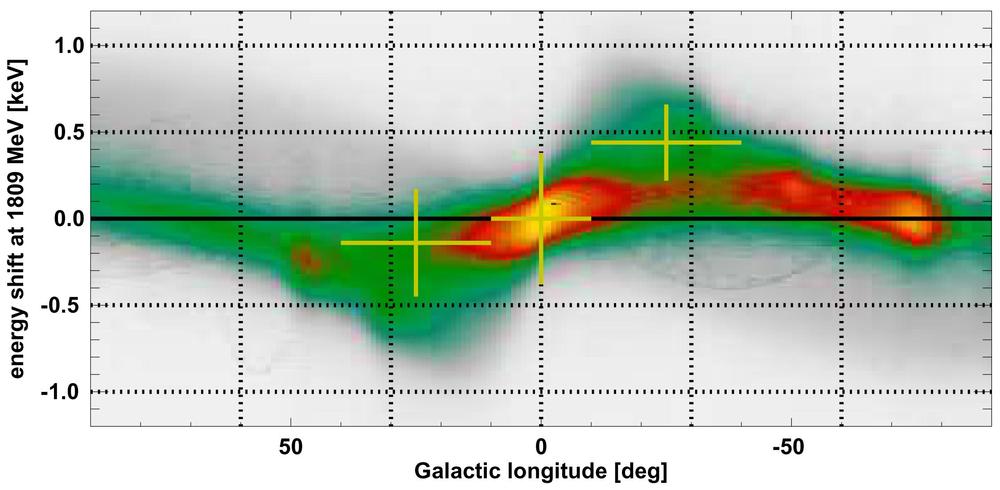
Credits: MPE Hi-Res Expected shifts of the gamma-ray line at 1809 keV - emitted by the decay of Al 26 - caused by the Doppler effect along the plane of the galaxy, as they result from galactic rotation. The modelled distribution of sources (coloured) agrees with the measured line position changes from INTEGRAL/SPI (yellow crosses). See ESA's press release Publication: Diehl et al. 2006, Nature 439, 45 (PDF [158 K]) |
 16 NOV 2005
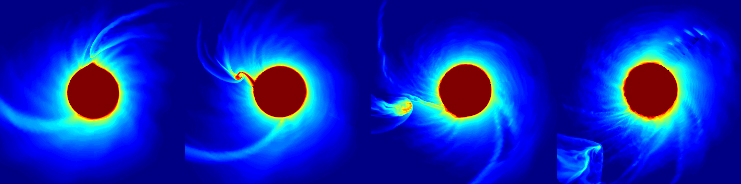
Credits: J.M. Blondin, North Carolina State University Simulated sequence showing the interaction between the stellar material carried by the wind of a supergiant star and its "receiving" companion - a compact stellar object such as a neutron star or a black hole. In the vicinity of the compact object it is possible to see the development of a turbulent shocked flow. See ESA's Press Release |
 16 NOV 2005
Credits: ESA Hi-Res Artist's impression of a supergiant fast X-ray transient (SFXT) a rare class of binaries composed of a supergiant luminous star (in blue) and a compact object, such as a neutron star or a black hole. The curve at the bottom right shows how the intensity of the X-rays recorded by INTEGRAL changed within only about 2 hours on 17 September 2003 in one of these sources, called IGR J17544-2619. See ESA's Press Release |
 21 OCT 2005
Credits: J. Rodriguez (CEA, Saclay) Lightcurves of the microquasar GRS 1915+105 observed on 17-19 October 2005 by INTEGRAL (rev. 367 & 368). The flux variations have been extracted in three JEM-X energy bands (upper panel) and in two IBIS/ISGRI bands (lower pannel). The flux in the JEM-X 5-12 keV and 12-20 keV bands has been multiplied by two for the sake of clarity. |
 10 OCT 2005
Credits: ISDC/M. Türler INTEGRAL discovery image of IGR J17269-4737 as observed by the IBIS/ISGRI instrument on Oct. 6-7, 2005 in the 20-40 keV energy range. This X-ray transient was independently discovered at low energy X-rays by RXTE as XTE J1727-476. Follow-up observations by SWIFT and ground based telescopes could find the exact position of the source at X-ray, optical and infrared wavelengths. For more information see: ATels 623, 624, 625, 626, 628, 629, 631, 632 |
 7 SEP 2005
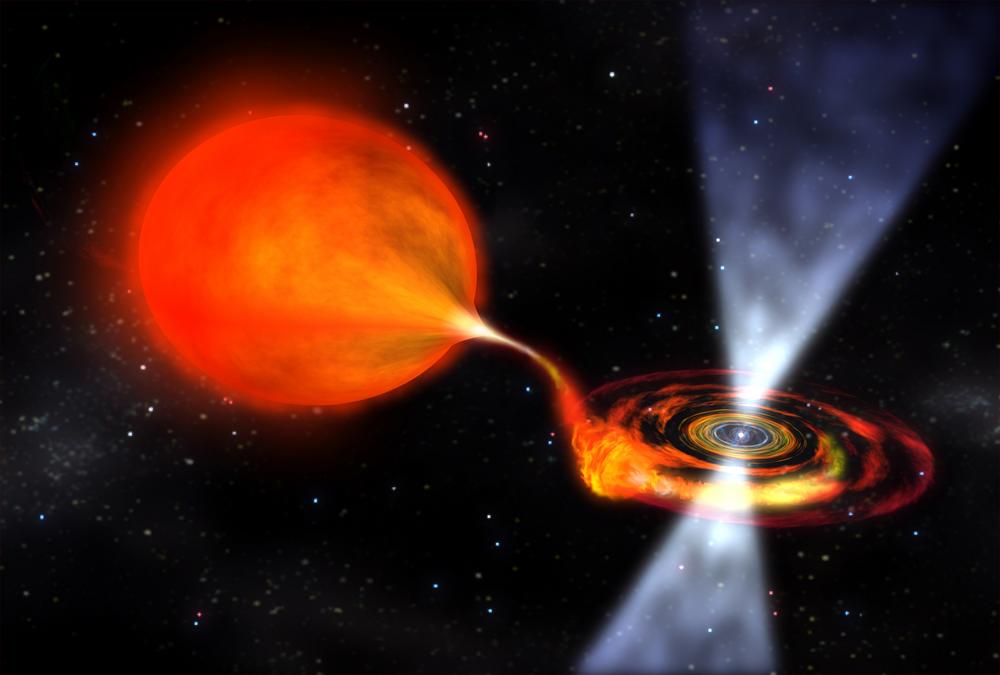
Credits: NASA/Dana Berry Hi-Res Artist's impression of a pulsar, approximately 20 kilometres in diameter, accreting material from a companion star. The strong gravity from the dense neutron star (the pulsar) attracts material from the companion. The flow of gas from the companion to the pulsar forms a disc of very rapidly rotating plasma. The innermost material splashes onto the magnetic poles of the pulsar and emits X-rays. The observed X-rays are modulated by the rapid spinning of the pulsar. Millisecond pulsars like IGR J00291+5934, discovered on 2 dec. 2004, can spin as fast as about 600 times per second. See ESA's press release Publication: Falanga et al. 2005, astro-ph/0508613 |
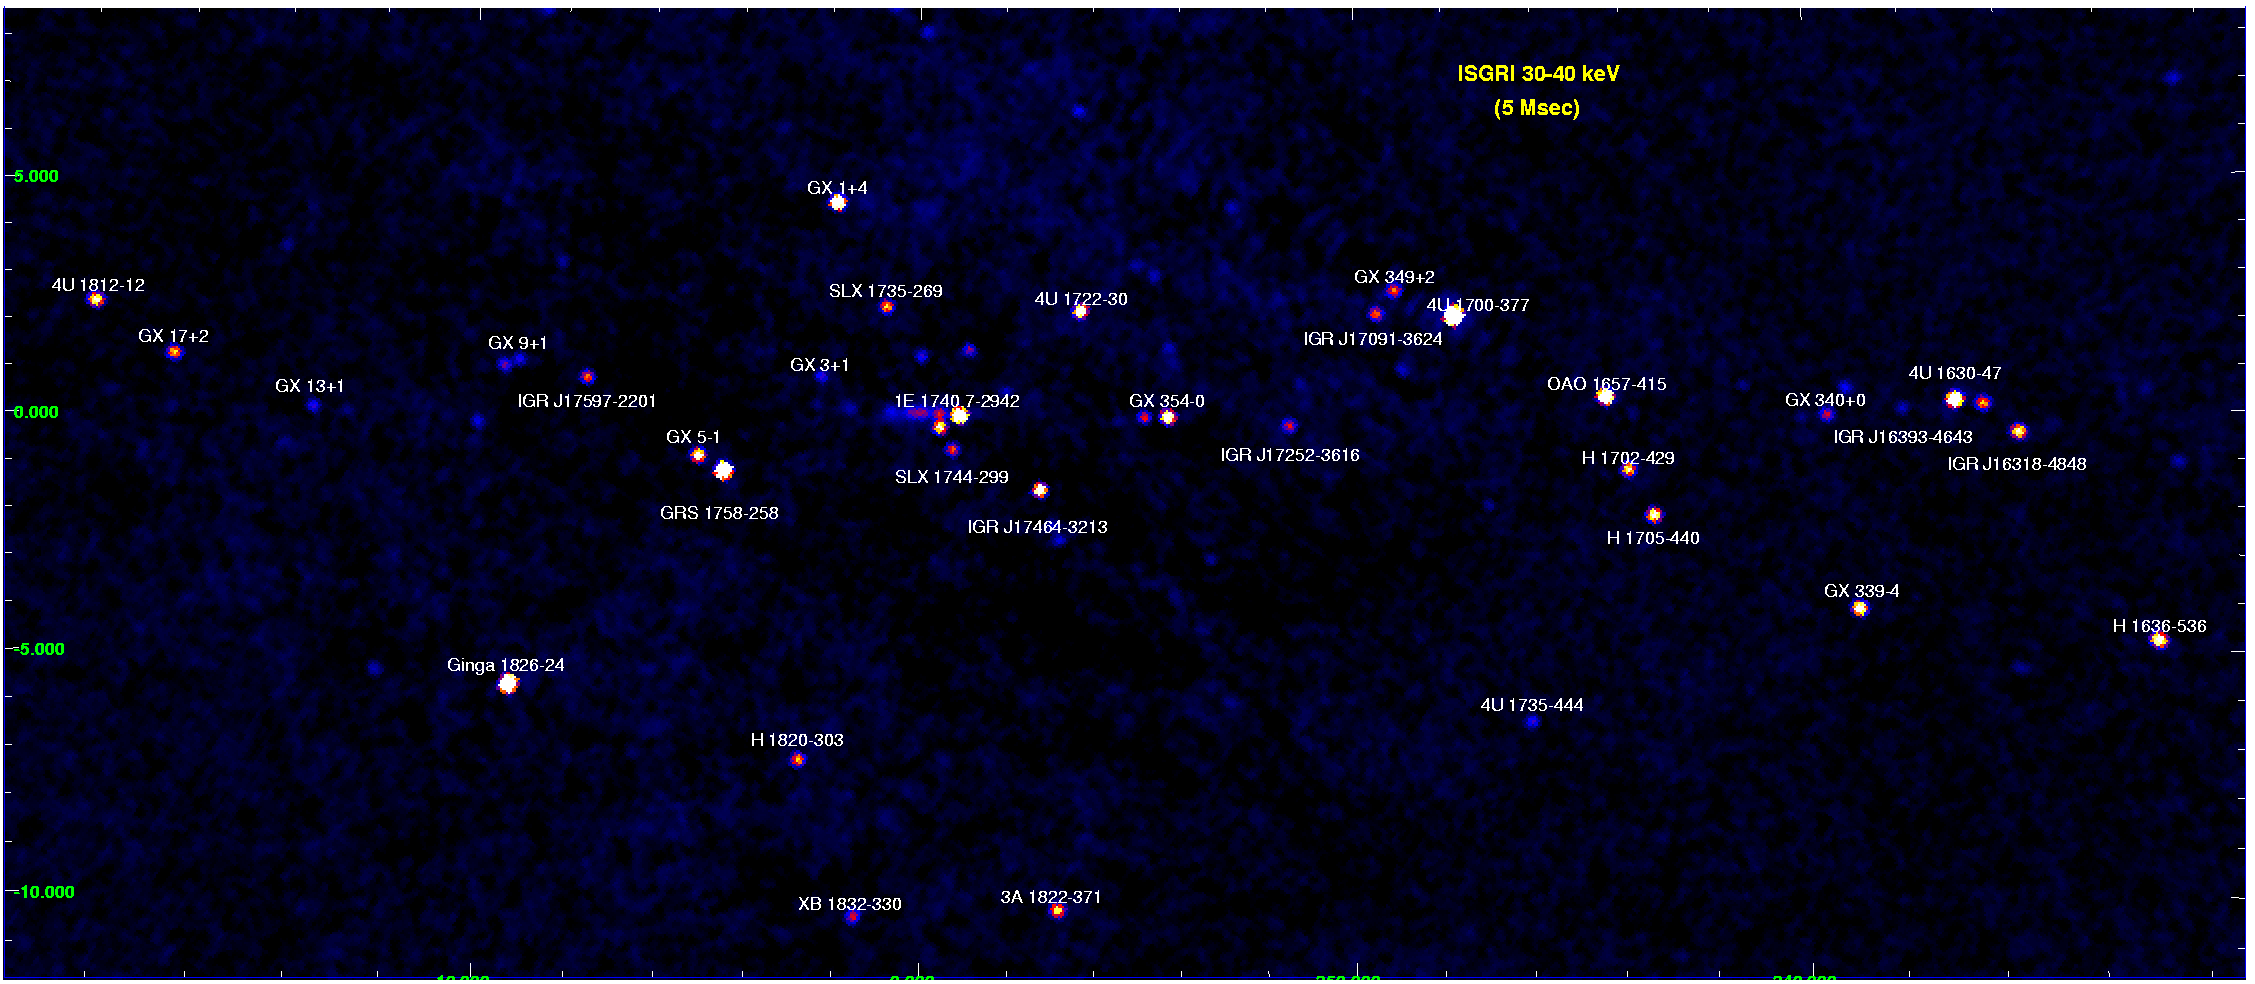
 10 AUG 2005
Credits: A. Paizis (ISDC, Geneva & IASF/CNR, Milano) Hi-Res IBIS/ISGRI mosaic image of the Galactic Centre in the 30-40 keV band obtained with OSA 5 on ~5 Msec of public data. Only some sources have been labelled for clarity. Publication: Paizis et al., 2005, in preparation |
 14 JUL 2005
Credits: S. Soldi (ISDC, Geneva) Hi-Res Discovery image of IGR J16283-4838 taken on 7 April 2005. This IBIS/ISGRI mosaic image in the 20-60 keV band showing the sources in the Norma arm of the Milky Way was made by Simona Soldi as part of the scientific data check at the end of each revolution. Two other satellites NASA's Swift and Rossi-XTE, observed the source soon after it's discovery and the combined data finally allowed to determine that the elusive source is a highly obscured binary system with a high-mass star orbiting a neutron star. IGR J16283-4838 is the seventh object discovered by INTEGRAL and identified as being a highly absorbed X-ray binary system. Press releases: ESA, GSFC, Uni. Genève, News of 2005/07/14 [2'12" video] on Swiss TV. Publication: Beckmann et al., 2005 astro-ph/0506170 |
 14 JUL 2005
Credits: S. Soldi (ISDC, Geneva) Hi-Res Zoom into the discovery image of IGR J16283-4838 taken on 7 April 2005. This IBIS/ISGRI mosaic image in the 20-60 keV band was made by Simona Soldi as part of the scientific data check at the end of each revolution. Two other satellites NASA's Swift and Rossi-XTE, observed the source soon after it's discovery and the combined data finally allowed to determine that the elusive source is a highly obscured binary system with a high-mass star orbiting a neutron star. IGR J16283-4838 is the seventh object discovered by INTEGRAL and identified as being a highly absorbed X-ray binary system. Press releases: ESA, GSFC, Uni. Genève, News of 2005/07/14 [2'12" video] on Swiss TV. Publication: Beckmann et al., 2005 astro-ph/0506170 |
 19 MAY 2005
Credits: A. Paizis (ISDC, Geneva & IASF/CNR, Milano) IBIS/ISGRI mosaic of the Galactic Centre region (20-40 keV, 5.7 Msec). Only the main sources are labelled for clarity. The majority of the visible sources are Low Mass X-ray Binaries (LMXRBs). In these objects, the physical process at the origin of the production of such energetic X-rays is inverse Comptonisation of soft seed photons (from the accretion disc and/or neutron star surface) by a hot plasma present in the system (accretion disc corona, neutron star boundary layer, accelerated particles in jets, etc). Publication: Paizis et al., 2004, Proceedings of the 5th INTEGRAL Workshop "The INTEGRAL Universe" |
 19 MAY 2005
Credits: A. Paizis (ISDC, Geneva & IASF/CNR, Milano) Animation of four IBIS/ISGRI mosaic images of the galactic centre region in four different energy bands: 20-40 keV, 40-60 keV, 60-80 keV and 80-100 keV. The sources become dimmer and dimmer at higher energies because the number of photons they release decreases from the lower energy X-rays to the higher energy gamma-rays. The total exposure time is of 5.7 Msec. The main sources are labelled in the lowest energy (20-40 keV) image. The majority of the visible sources are Low Mass X-ray Binaries (LMXRBs). Publication: Paizis et al., 2004, Proceedings of the 5th INTEGRAL Workshop "The INTEGRAL Universe" |
 19 MAY 2005
Credits: A. Paizis (ISDC, Geneva & IASF/CNR, Milano) IBIS/ISGRI mosaic image of the galactic centre region around GX 5-1. Thanks to the high imaging capability (angular resolution) of INTEGRAL, we are for the first time able to disentangle the hard X-ray emission of the neutron star low mass X-ray binary GX 5-1 (centre of the image), from the nearby black hole candidate GRS 1758-258 (40 arcmin away). We interpret the hard X-ray emission from GX 5-1 as Compton up-scattering of soft photons from the neutron star surface due to a thin hot plasma expected in the boundary layer. Publication: Paizis et al., 2005, A&A, submitted |
 11 MAY 2005
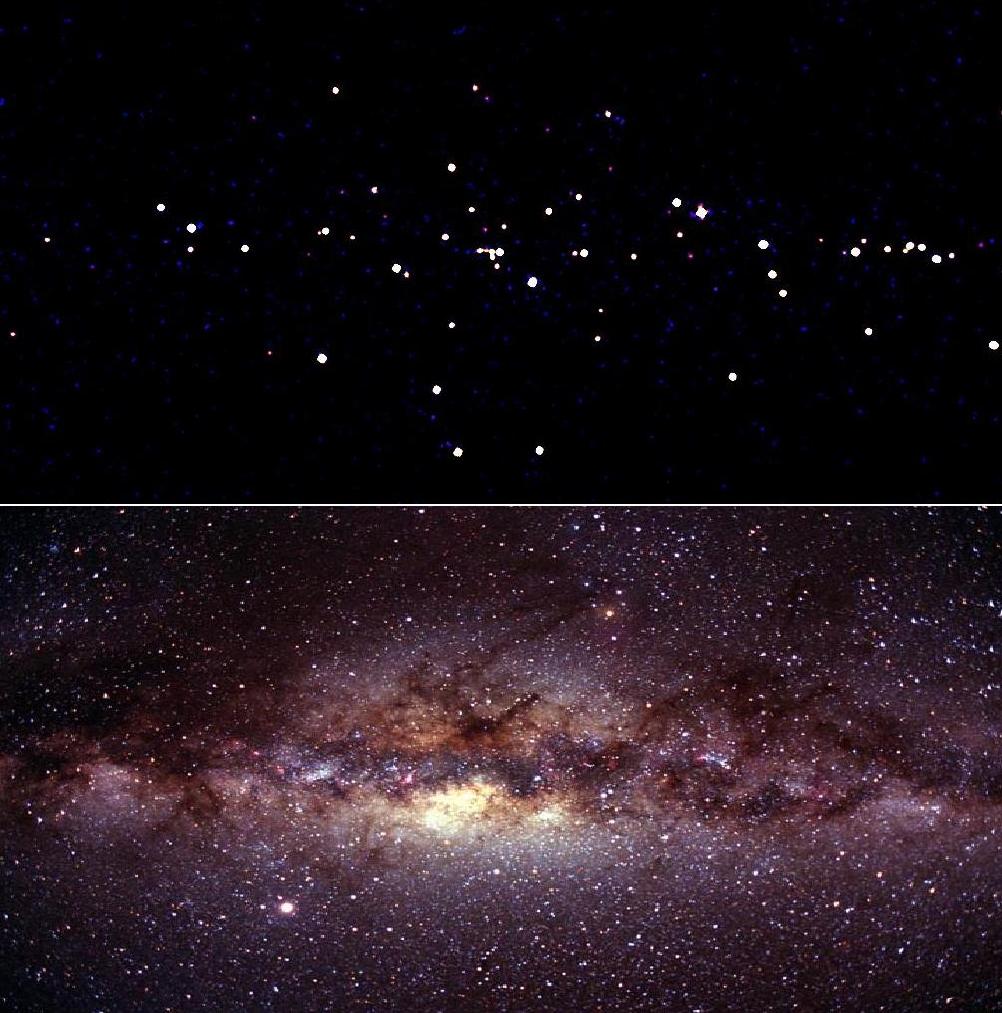
Credits: gamma-rays: R. Walter & A. Bodaghee (ISDC, Geneva); visible: Fred Espenak The top figure features a deep exposure of the Galactic Center as seen by IBIS/ISGRI in the 20-60 keV band, and the bottom figure presents the same region in the familiar optical/visible part of the spectrum. The ISGRI image is constructed from a mosaic of significance maps collecting over 1 million seconds of exposure time. These figures demonstrate INTEGRAL's ability to peer through the thick cloud of dust and gas that veils the inner regions of the Milky Way. INTEGRAL has revealed a number of bright, high-energy sources that are concentrated primarily in the center and along the plane. The sources clustered to the right of the ISGRI image belong to the Norma Arm. |
 11 MAY 2005
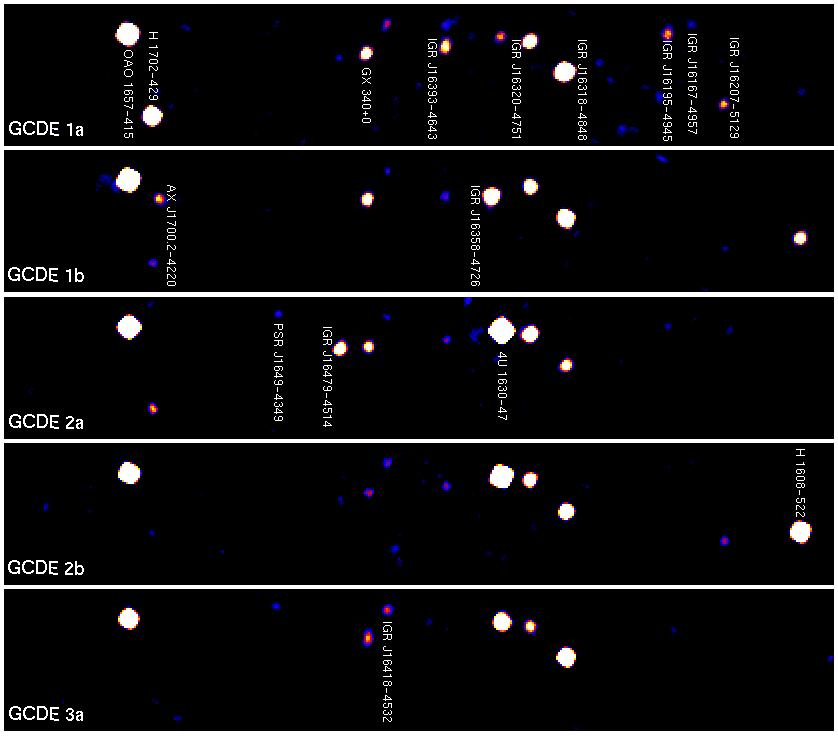
Credits: A. Bodaghee & R. Walter (ISDC, Geneva) This figure presents the Norma Arm (a spiral arm in our galaxy, the Milky Way) as seen by ISGRI in the 30-50 keV band during 5 successive observation periods (GCD1a: 2003-01-29 to 2003-03-15; GCDE 1b: 2003-03-15 to 2003-04-17; GCDE 2a: 2003-08-02 to 2003-08-19; GCDE 2b: 2003-08-19 to 2003-10-08; GCDE 3a: 2004-02-16 to 2004-03-17). The images are derived from mosaics of the significance map and they collect (from top to bottom) 261, 117, 188, 158, and 93 kiloseconds of exposure time, respectively. Each image represents an area about 15 degrees wide by 3 degrees tall in galactic coordinates. Most of the sources were discovered by INTEGRAL and are probably members of the class of highly-absorbed X-ray binaries typically found in the spiral arms of the Milky Way. |
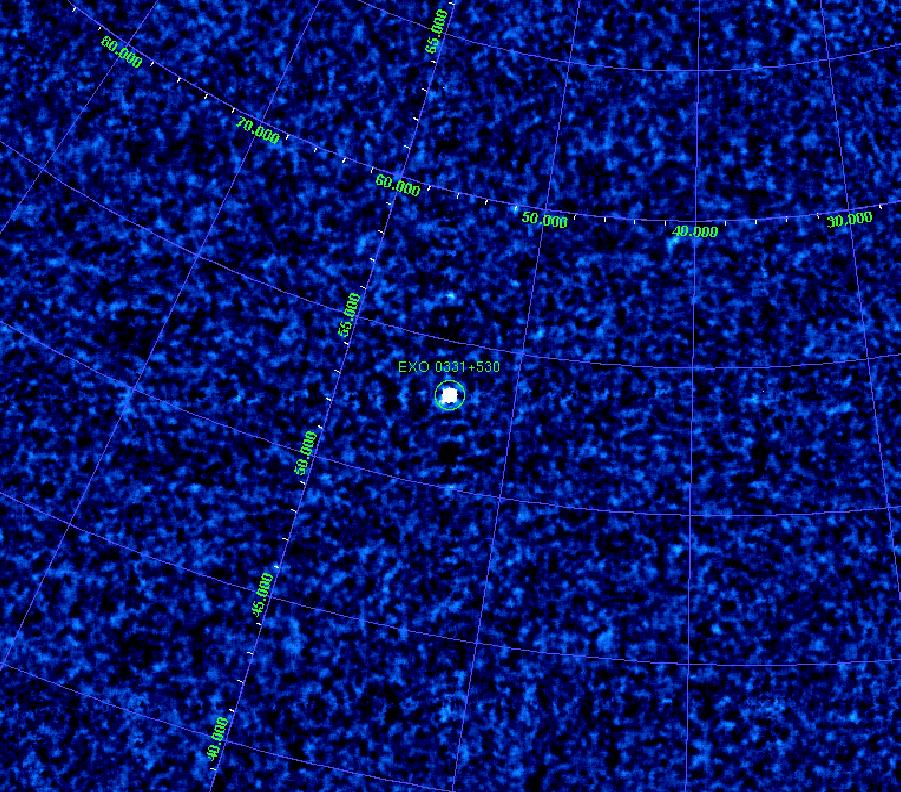 10 MAY 2005
Credits: I. Kreykenbohm (ISDC, Geneva) INTEGRAL IBIS/ISGRI image of the transient X-ray pulsar V 0332+53 (=EXO 0331+530) during it's outburst of December 2004 - January 2005. V 0332+53 is a neutron star orbiting a high-mass companion star located in the disk of our galaxy, the Milky Way at a distance of about 7 kpc. The recent outburst observed by INTEGRAL was the first outburst since 1989. During the maximum, the source reached about 1 Crab making it one of the brightest sources in the gamma-ray sky. The neutron star spins with a period of 4.375 seconds giving rise to pulsations. The high energy spectrum exhibits three beautiful, harmonically spaced cyclotron lines at 25 keV, 51 keV, and 72 keV allowing to determine the magnetic field of the neutron star to B = 2.7 1012 Gauss. Publication: Kreykenbohm et al., 2005, A&A Letters 433, 45 |
 10 MAY 2005
Credits: I. Kreykenbohm (IAA Tübingen & ISDC) INTEGRAL spectra of the transient X-ray pulsar V 0332+53 (=EXO 0331+530) during it's outburst of December 2004 - January 2005. The combined JEM-X (red) and IBIS/ISGRI (blue) spectrum exhibits three beautiful, harmonically spaced cyclotron lines at 25 keV, 51 keV, and 72 keV allowing to determine the magnetic field of the neutron star to B = 2.7 1012 Gauss. The figure shows the analysis of this spectrum: a) data + folded cutoffpl model b) residuals for model without any CRSFs c) after fitting the fundamental 25 keV line d) the fundamental line and the first harmonic at 50 keV have been fitted e) all three lines have been fitted. Publication: Kreykenbohm et al., 2005, A&A Letters 433, 45 |
 9 MAY 2005
Credits: E. Kuulkers (ESA/ESAC, Spain) This animation illustrates the varibility of the gamma-ray sky as seen by INTEGRAL in the central region of our galaxy, the Milky Way. The sources seen in this sequence of IBIS/ISGRI images are binary systems composed of a compact object (a neutron star or a black hole) orbiting a normal companion star. It is the matter orbiting very close to the compact object that emits X-rays and gamma-rays. |
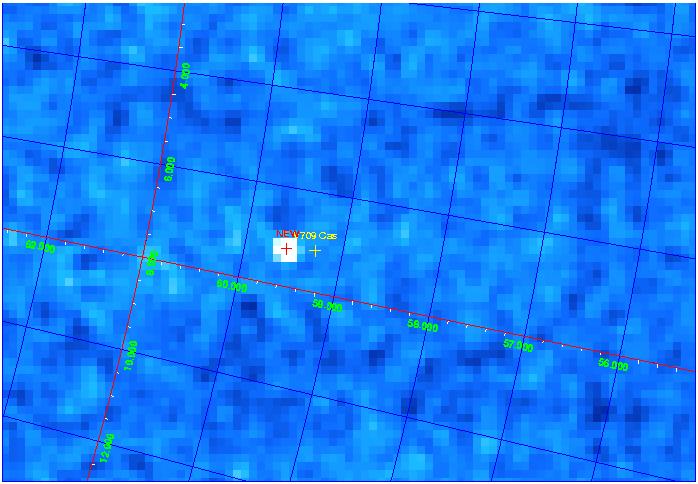 9 MAY 2005
Credits: S. Shaw (Southampton & ISDC) The source imaged, IGR J00291+5934 (labeled as "NEW"), was discovered on December 2nd, 2004 by D. Eckert, then Scientist in Duty in the ISDC Barn. This source is spinning 600 times per second while it orbits a companion star in 2.5 hours. This discovery provides a very important link in the theory of neutron stars between the classical pulsars and the very fast spinning millisecond pulsars that have been discovered in the last decades as it allows us to understand how the spin can be accelerated. After having appeared in the sky in early December, this source disappeared again in January 2005, we are looking forward to seeing it again, should it reappear while INTEGRAL is still operational. Publication: Shaw et al., 2005, A&A Letters 432, 13 |
 5 AUG 2004
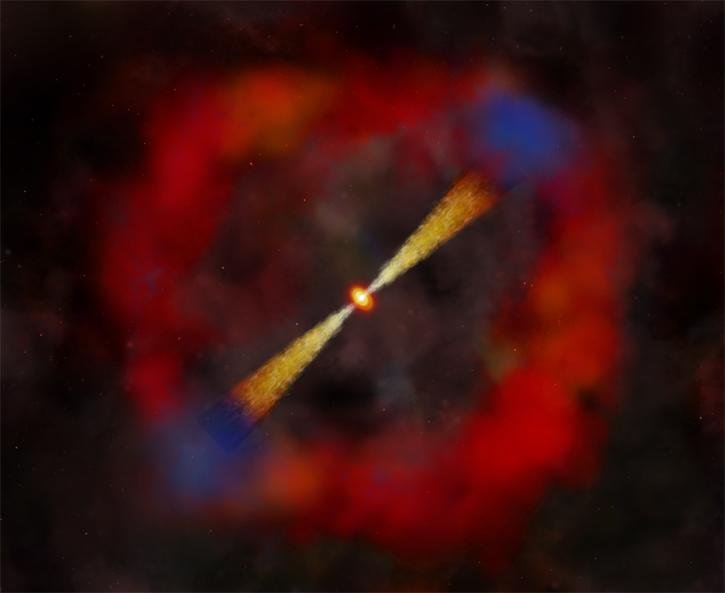
Credits: CXC, M. Weiss Artist's impression of gamma-ray burst like the one detected by INTEGRAL on 3 December 2003. A double-jet of high-energy particles ejected by a rapidly rotating black hole interacts with surrounding matter. |
 20 JUL 2004
Credits: ESA, V. Beckmann (GSFC) Artist's impression of the dust torus (doughnut-shaped cloud) believed to surround the supermassive black hole deep in the core of an active galaxy. When the torus is viewed from the side as shown here, dust blocks our view of the active nucleus in visible light, but not in X- and gamma-rays. |
 18 MAR 2004
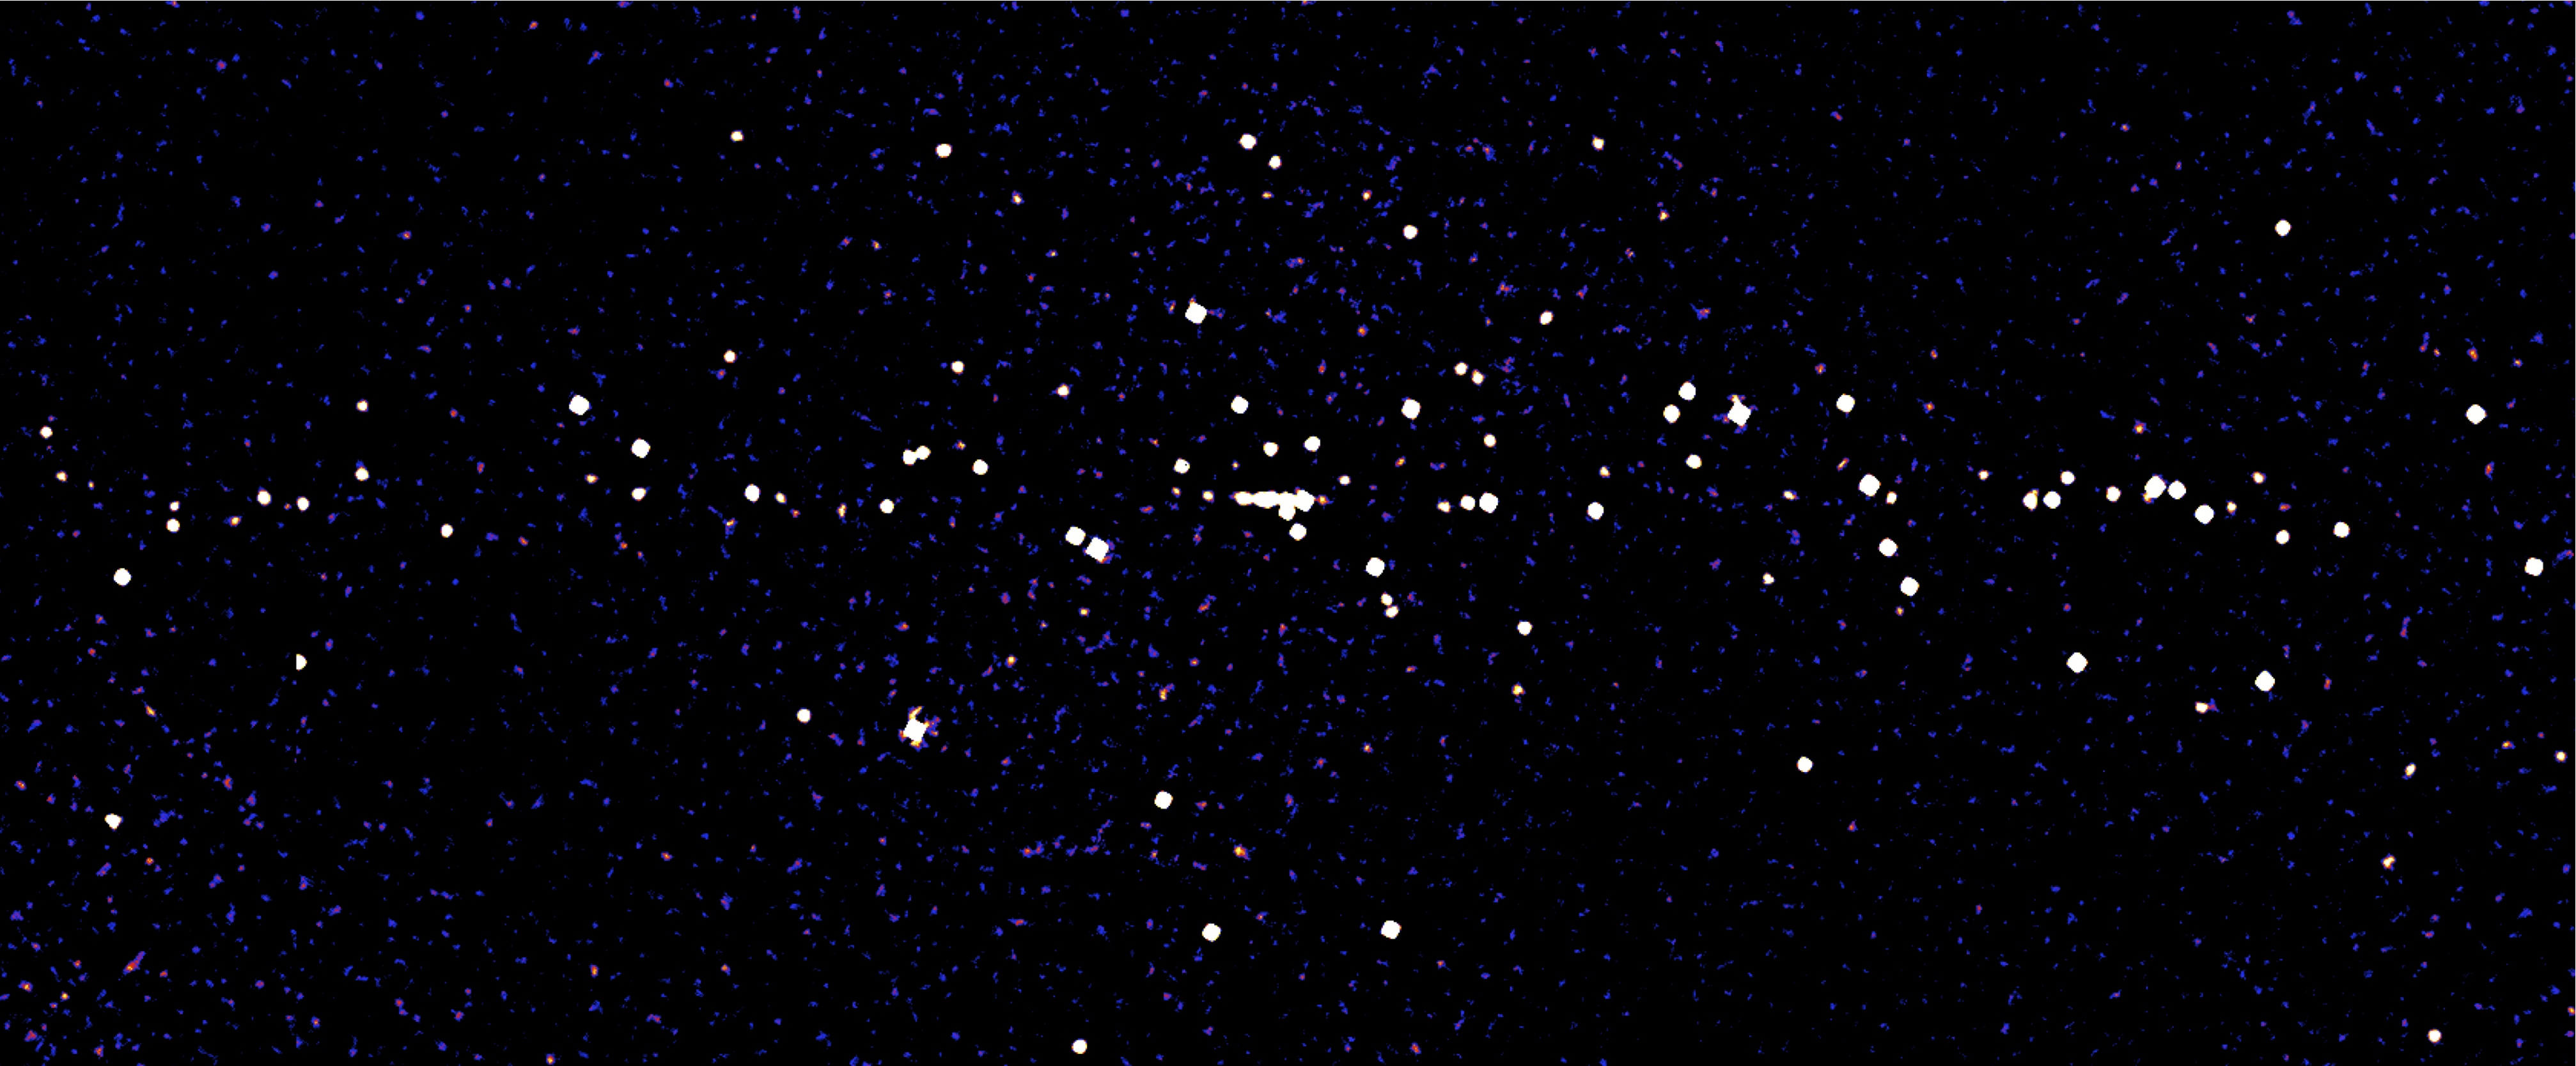
Credits: ESA, F. Lebrun (CEA-Saclay) Hi-Res The central regions of our Galaxy, the Mikly Way, as seen by INTEGRAL in gamma-rays. With its superior ability to see faint details, Integral correctly reveals the individual sources that comprised the foggy, gamma-ray background seen by previous observatories. The brightest 91 objects seen in this image were classified by Integral as individual sources, while the others appear too faint to be properly characterised at this stage. |
 17 OCT 2003
Credits: ESA An artist's impression of the mechanisms in an interacting binary system. The supermassive companion star (on the right-hand side) ejects a lot of gas in the form of 'stellar wind'. The compact black hole orbits the star and, due to its strong gravitational attraction, collects a lot of the gas. Some of it is funnelled and accelerated into a hot disc. This releases a large amount of energy in all spectral bands, from gamma rays through to visible and infrared. However, the remaining gas surrounding the black hole forms a thick cloud which blocks most of the radiation. Only the very energetic gamma rays can escape and be detected by Integral. |
 2004
2004Credits: ISDC/M. Türler Hi-Res | .eps Comparison of images of the quasar 3C 273 taken in different ranges along the electromagnetic spectrum. It illustrates the difficulties of gamma-ray imaging with coded masks compared to techniques at radio (MERLIN), optical (Hubble) and X-ray (Chandra) wavelengths. INTEGRAL cannot resolve the jet of the quasar streching over about a million light-years, about 10 times the diameter of the Milky Way. |
 2004
2004Credits: ISDC Hi-Res | .ps INTEGRAL observation of the quasar 3C 273 showing hard X-ray emission (at 20-40 keV) collected by the IBIS/ISGRI detector. The two other sources besides 3C 273 are nearby Seyfert galaxies. |
 2003
2003Credits: J. Rodriguez (ISDC) IBIS/ISGRI image of a small field close to GRS 1915+105 and the newly detected source IGR J19140+0951. |
 16 DEC 2002
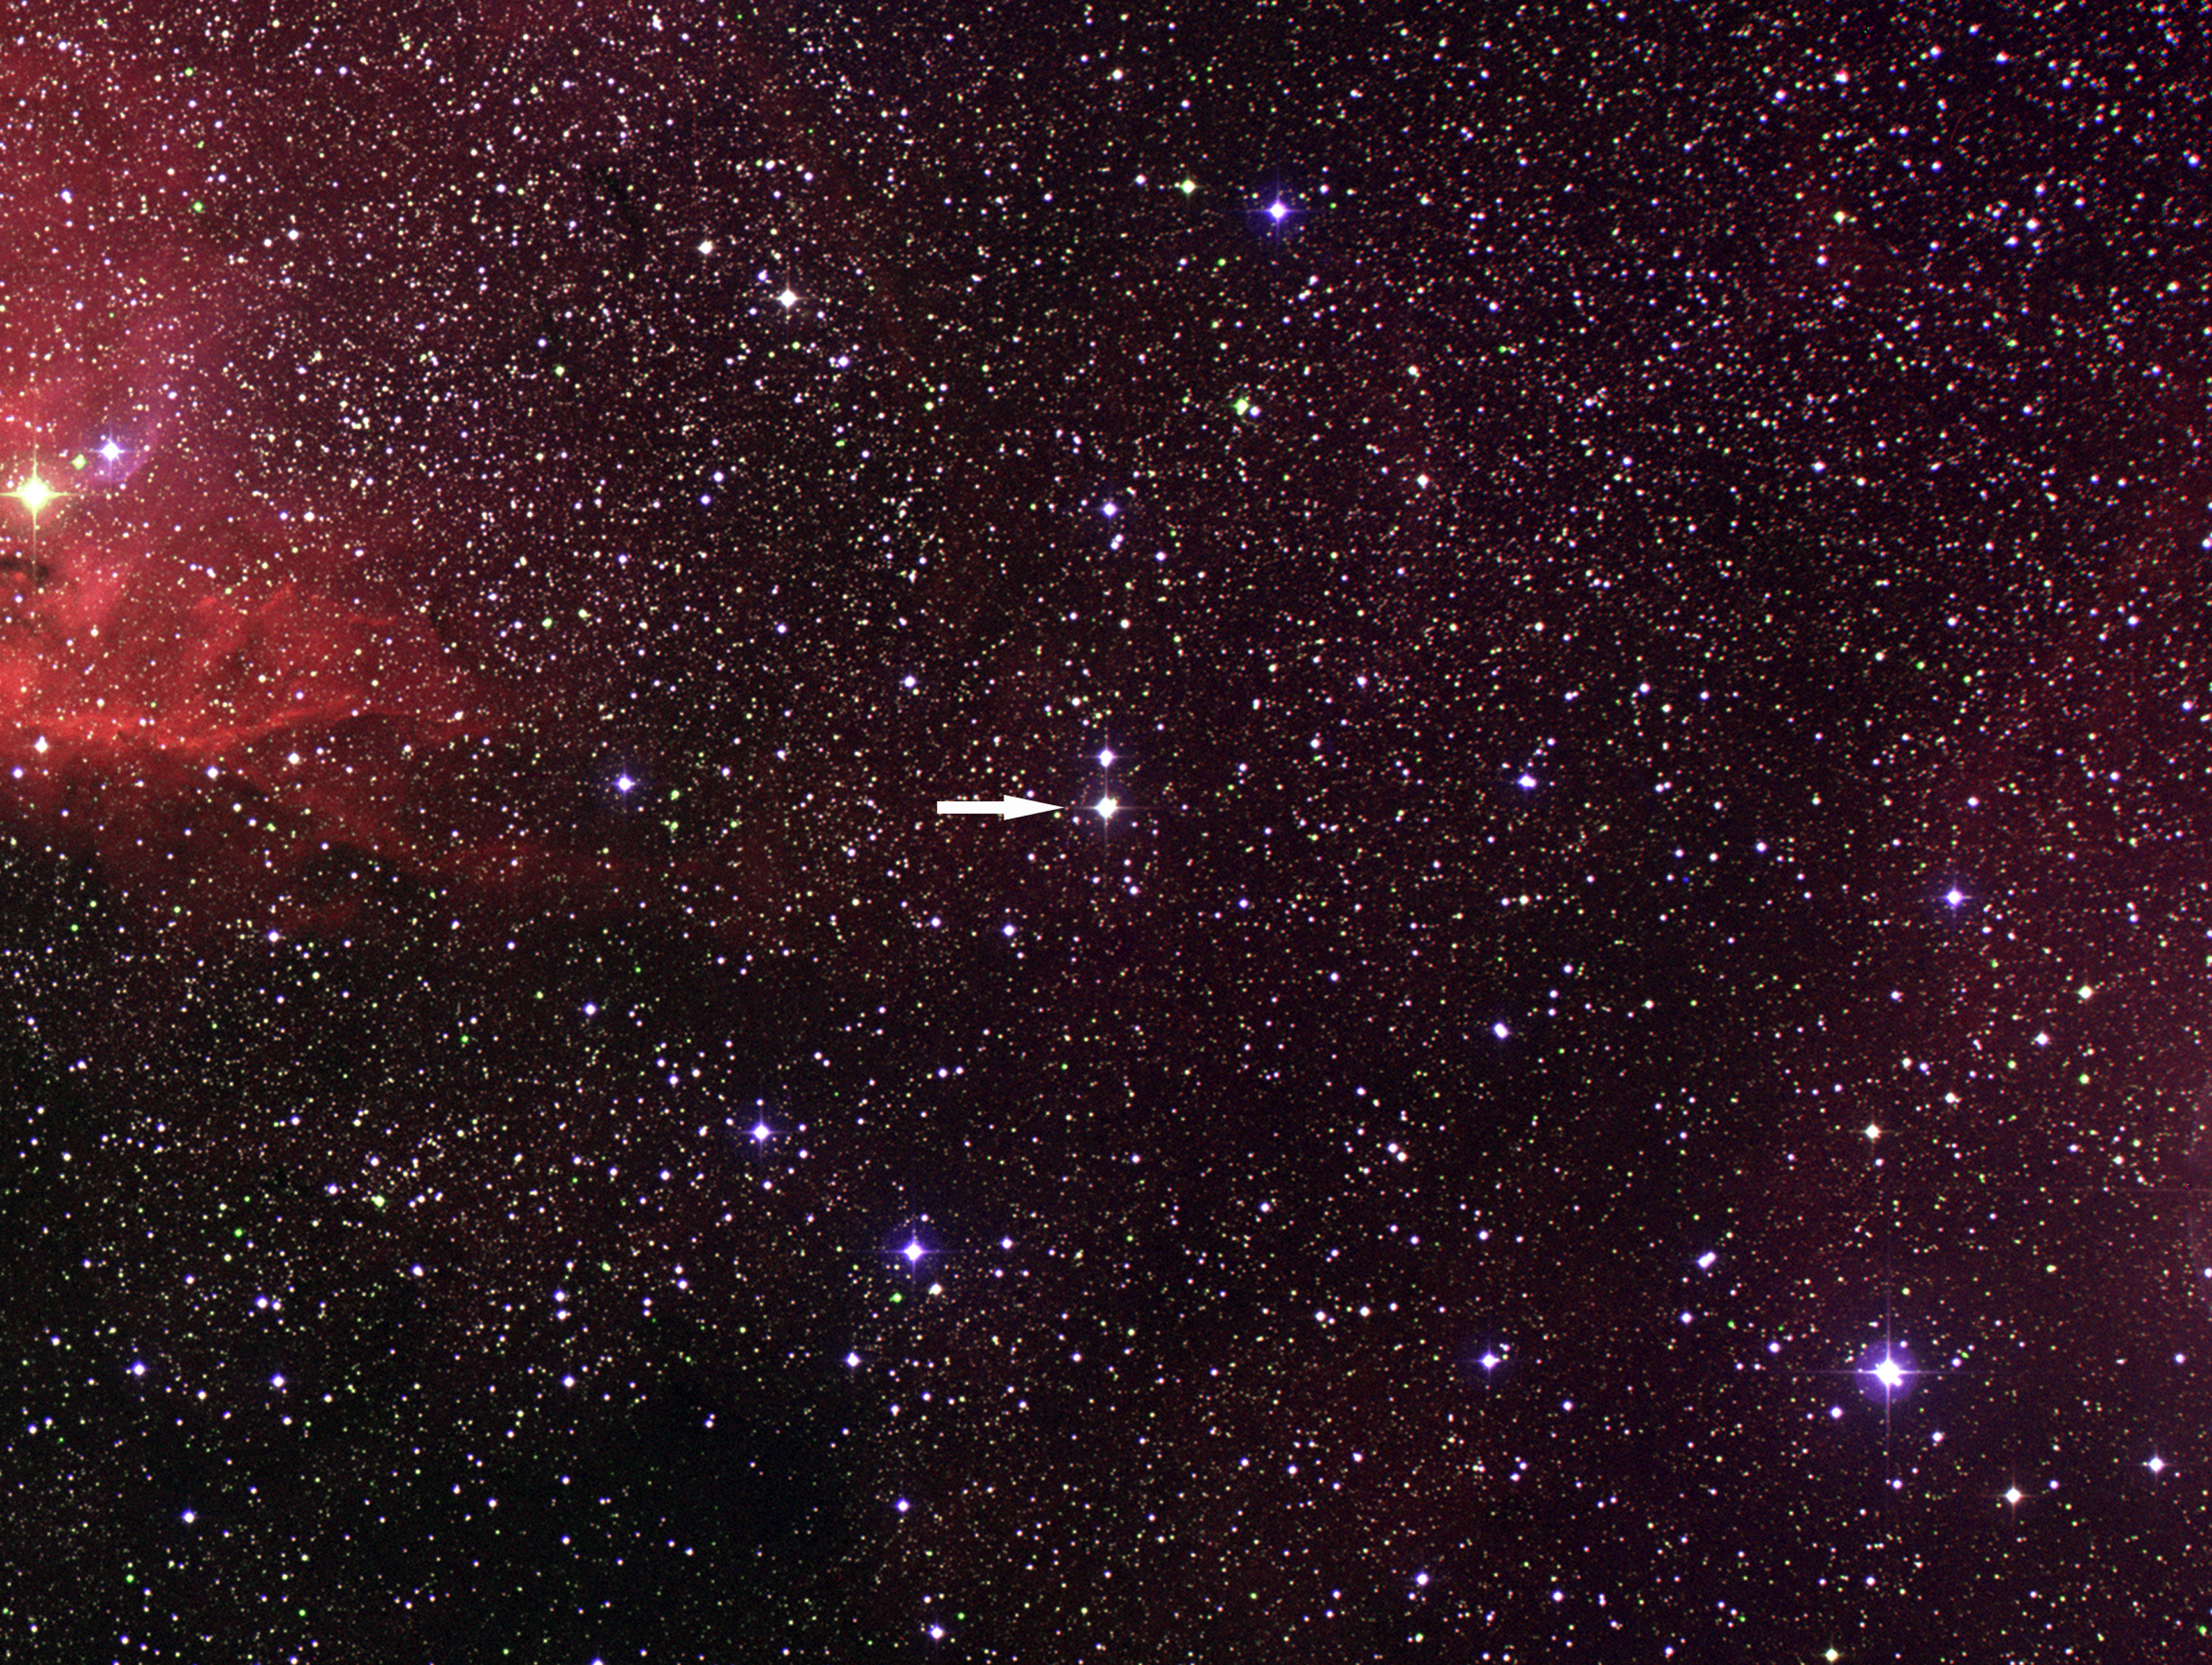
Credits: ESA & Digitized sky survey. Image processing by ESA/ECF Hi-Res Visible light image showing a small region of the Cygnus constellation around the Cygnus X-1 binary, which is indicated by an arrow. See ESA's Press Release |
 16 DEC 2002
Credits: ESA. Illustration by the Integral team and ESA/ECF Hi-Res Composite "first-light" image of Cygnus X-1 obtained by the four instruments aboard the INTEGRAL spacecraft overlayed on an artist's view of this binary system. See ESA's Press Release |
 16 DEC 2002
Credits: ESA. Illustration by Martin Kornmesser, ESA/ECF Hi-Res Artist's view of the binary system Cyg X-1. It shows how matter from the giant blue star (left) is accreted in a spiraling disk of material around a black hole (right). See ESA's Press Release |
 25 NOV 2002
Credits: S. Mereghetti, D. Götz (IASF/CNR, Milano) Image and lightcurve of the first gamma-ray burst detected in the field-of-view of the IBIS instrument on November 25, 2002, just one month after INTEGRAL's launch. |
 25 NOV 2002
Credits: ESA. Illustration by the Integral IBIS Team & ESA/ECF Hi-Res IBIS image of the first gamma-ray burst occuring in its field of view on November 25, 2002 overlayed on an artistic representation of those most powerful cosmic explosions. |
 25 NOV 2002
Credits: ESA. Illustration by ESA/ECF Hi-Res Artist's impression of a gamma-ray burst. |
 2002
2002Credits: R. Hynes Artist's view of the microquasar binary system GRS 1915+105. The image has been created with the BinSim software by Robert Hynes (Louisiana State University). |
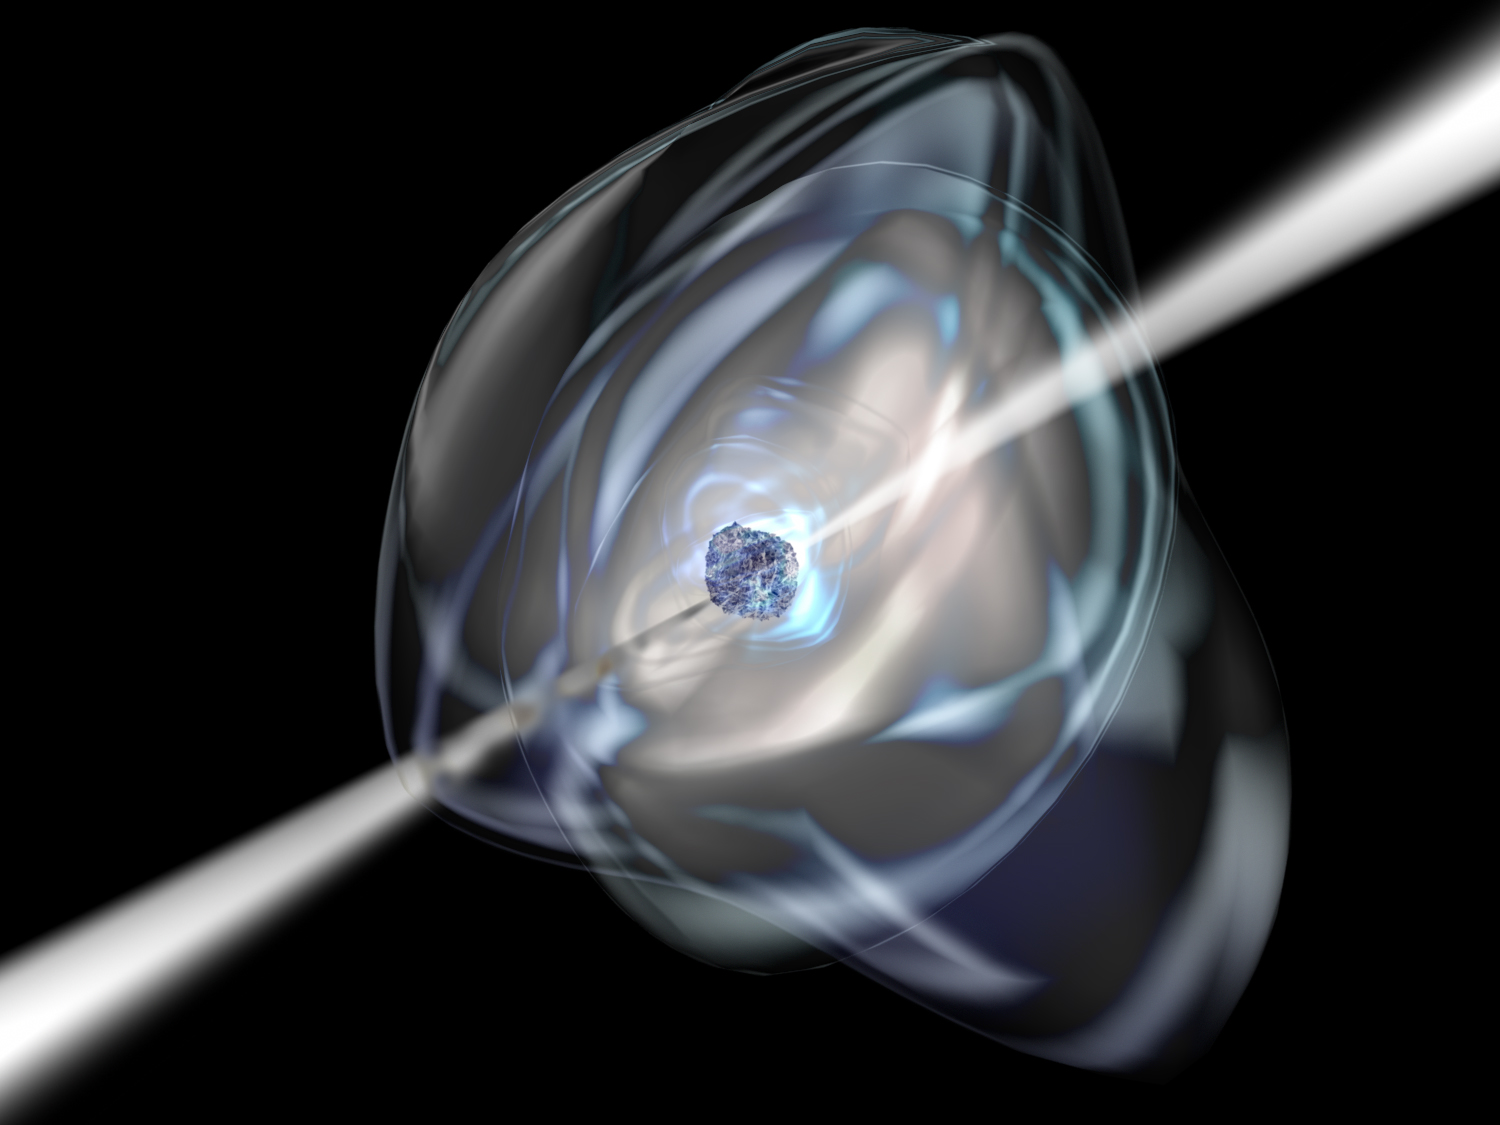
 Credits: ESA 2002/Medialab
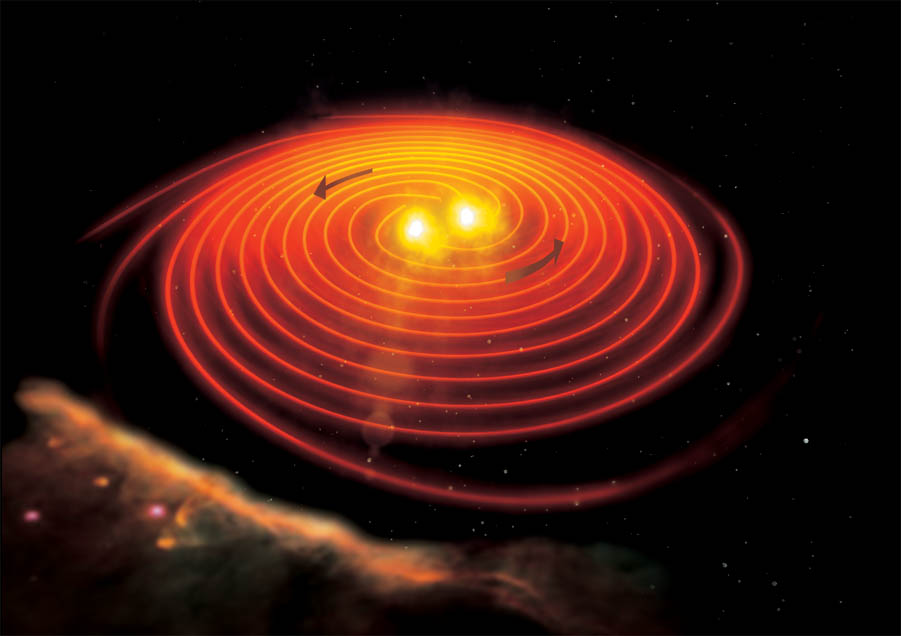
Artist's impression of two neutron stars merging into a black-hole. Such events are probably responsible for some gamma-ray bursts. |
 Credits: ESA 2002/Medialab
Artist's impression of a super-massive black hole, the size of our Solar System, thought to lurk in the heart of most galaxies. |
Additional images:
▸ All Images in the ISDC-Astrophysics Newsletters
▸ ESA’s INTEGRAL
Picture of the Month


