Now you can go to the directory created with og_create and start the analysis
cd obs/crab
jemx_science_analysis startLevel="COR" endLevel="IMA" nChanBins=-2 jemxNum=2
The above command launches the analysis which will run from the Correction step (startLevel="COR") up to the image creation level (endLevel="IMA"). It is important to specify that we are interested in the second of JEM-X instruments: jemxNum=2. The nChanBins parameter specifies the energy binning. In this case we are going to extract images in 4 ``std'' energy bands (see section
![[*]](crossref.png) for details).
for details).
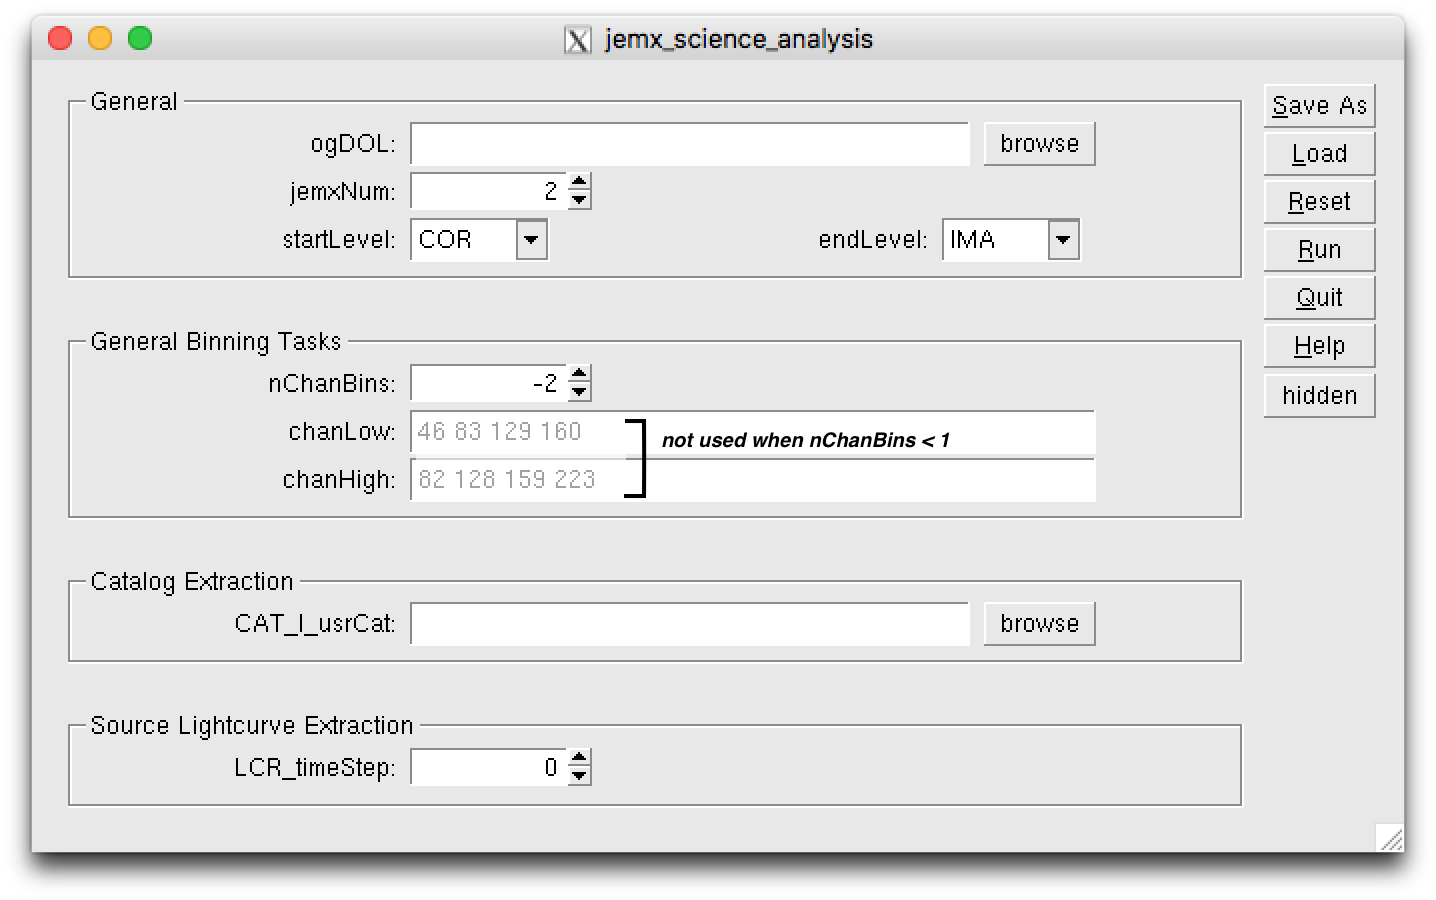
At the beginning the script launches the GUI (Fig. ,
unless you defined the environment variable COMMONSCRIPT, as explained
in Sect. )
). Only the most
important parameters (shown in bold in Table ) appear
within the main panel of GUI. To access the other ``hidden'' parameters
click on the button hidden on the right side of the
panel.
In the upper frame of the front panel called ``General'' you can choose
at which level you want to start and stop the script execution. In
the Overview chapter you have seen that there are different processing
levels of
the analysis. You can choose to run only some of them. The default
settings of the jemx_science_analysis script are
| startLevel="COR" | start the script at COR level, |
| endLevel="IMA2" | stop the script at IMA2 level (i.e. the last possible step for JEMX, mosaic creation). |
If you want to skip some levels, click on the hidden button on the
right of the GUI panel to access the whole set of jemx_science_analysis parameters. In the frame ``General'' you
find the skipLevels parameter. However, be always careful while
setting this parameter - levels often depend on the previous ones, so
make sure that your selection makes sense. Another useful hidden
parameter IMA_skyImagesOut in the IMA section enables you to
choose the types of images which you want to output![[*]](footnote.png) .
.
Under the ``General Binning Tasks'' section you can provide the energy
bins for the scientific analysis. These values are used uniformly for
imaging, spectral and lightcurve extractions.
The automatic source detection is always obtained through j_ima_iros
in 3 default energy ranges: 3-7 keV, 7-11 keV and 11-20 keV,
independently of the energy ranges specified by the user for the scientific
analysis. These bands are used only to locate and identify the sources in
the field of view (FOV).
The flux of each source found in the FOV
is then extracted for all the energy bands specified under ``General
Binning Tasks'' in order to
profit from the vast improvement in the modelling of the JEM-X
instruments achieved through j_ima_iros since OSA v.8.
Also the images are extracted by default
in the same energy ranges specified under ``General Binning Tasks''
(this can be modified through the IMA_userImagesOut parameter; for more
details see section .) Images of the 3 default ``serach'' energy bands
can be stored in the output file by setting IMA_detImagesOut=yes.
This option however is not recommended if you later want to extract a
spectrum from the mosaic image.
In the middle of the GUI front panel you have a possibility to
choose a ``user input catalog'' (the parameter CAT_I_usrCat). At
the moment you can leave it empty (the software will use the general
INTEGRAL source catalog for the analysis). However, for the
correct extraction of spectra and lightcurves of the sources it is
recommended to create a ``user catalog'' with the positions of the
sources for which you plan to extract the spectra and/or the
lightcurves. We will come back to this in the following sections (and sect. ).
Once you are satisfied with the settings, save them by pressing the ``Save As'' button at the front panel of GUI and then press ``Run'' to start the data reduction.