


Next: Data Analysis
Up: Performance of the Instrument
Previous: Background
Contents
The sensitivity achieved for source
detection and flux determination also depends on the performance of
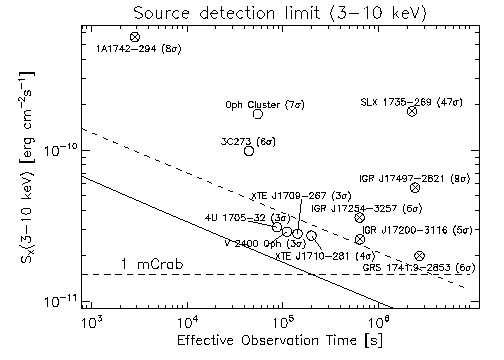
the deconvolution software. Figure ![[*]](crossref.png) shows the
3
detection limit as a function of observation time.
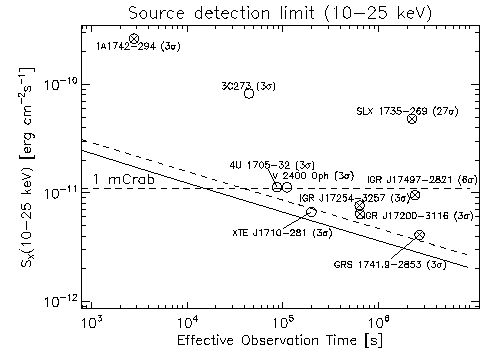
shows the
3
detection limit as a function of observation time.
The changes in gas gain and corresponding changes in signal patterns
led to a large fraction of events being classified as background and
rejected on-board until new selection criteria could be determined and
uploaded (2003-03-25, revolution 45). Even with the new optimized
selection criteria the detector sensitivity below 5 keV is reduced.
Figure:
Source detection capabilities in the 3 to 10 keV (resp. 10 to 25 keV)
band as function of effective accumulated observation (exposure) time in JEM-X
mosaic images corrected for dead time, grey filter and vignetting effects. The
thick solid curve is obtained from simulations where an isolated source must be
detected at
in the deconvolved image. The dashed line represents the
case where there are additional sources in the field of view giving a
background corresponding to a total of 1 Crab.
Examples of actual observations are given: the source 3C 273 and the other empty
circles are instances of isolated sources, while the crossed circles represent
sources observed in the crowded Galactic Centre region. The
-values given
in parentheses are obtained from a measure of the highest source pixel in significance mosaic maps with default pixel size (1.5 arcmin).
 |
Next: Data Analysis
Up: Performance of the Instrument
Previous: Background
Contents
inthelp@sciops.esa.int