PHA Binning
The energy values of the events provided in the telemetry are given as a bin
number from 0 to 255. These are non-linear groupings of the original 4096 bins
of the onboard ADC. JMXi-***B-MOD
data structures (Table ![[*]](crossref.png) ) indicate the ADC
bins covered by a given telemetry PHA bin. These data structures are part of the
instrument model group JMXi-IMOD-GRP (Table ). Each binning
table gives
a list of the highest ADC channel within each PHA bin.
) indicate the ADC
bins covered by a given telemetry PHA bin. These data structures are part of the
instrument model group JMXi-IMOD-GRP (Table ). Each binning
table gives
a list of the highest ADC channel within each PHA bin.
Each of the different data-taking modes has its own binning table data structure fitting its telemetry energy resolution. Tables with fewer than 256 bins are just subsets of the full 256-bin table.
| Column Name | Description |
| CHANNEL | Uppermost effective adc channel in a given telemetry bin |
See also Section for more details.
PI Binning
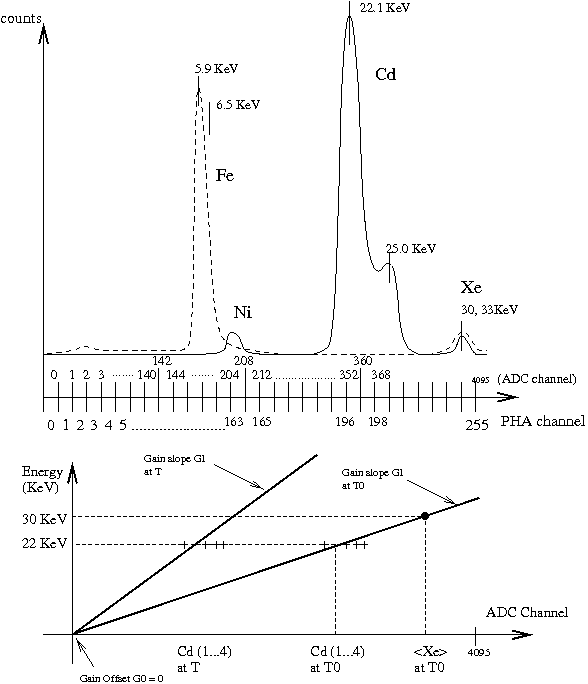
During automatic calibration the original PHA values of the events and spectra are converted into keV values based on the fitting of the Fixed Radiation Source System (FRSS) calibration spectra. The upper part of figure
shows the FRSS calibration spectra
which are used to determine the detector gain on
each of the four anode segments of both units at 4 minute intervals.
The standard FRSS setup has
a Cd-109 source with a Nickel window, but only one useable doublet is seen:
the Cadmium 22.1/25.0keV lines.
This spectrum is shown by the full line.
Anodes 0 and 2 of unit JEM-X each have an Fe-55 source for calibration, and the calibration spectrum from these anode segments is shown with the dotted line. This spectrum is modelled as an unresolved doublet at 5.9/6.1keV.
The FRSS spectrum is sent down as counts in each of 256 PHA channels (0 to 255) that cover logarithmically sized bins of the 4096 ADC channels of the ADC that registers the Pulse Height Amplitude. The uppermost ADC channel appearing in each PHA channel is given in the binning table JMXi-CALB-MOD in the instrument model group. The upper channel in the last bin must always be 4095. The logarithmic binning of the ADC channels is chosen to reflect the energy resolution of the detector, which is roughly .
Many things are expected to affect the pulse size the ADC will register for a given event energy: detector temperature, gas pressure, micro-strip plate charging, the age of the gas, and maybe some as yet unknown influences. This is why FRSS spectrum are sent in the housekeeping every 256 seconds to correct the gain continuously.
Since the ADC is known to be linear to better than the accuracy used by the telemetry we can assume a relationship between event energy and ADC channel, :
| (1) |
The PHA-binned spectra are fitted by gaussian line models and the resulting peak positions at 22.1KeV and 6 KeV are used to find the `raw' gain conversion factor G1, in KeV per ADC channel for the four minute interval. Both this value of G1 and the peak ADC channels are saved to JMXi-GAIN-CAL as keywords.
The contents of JMXi-GAIN-CAL is tabulated over an entire revolution (and over the entire mission) in a gain history table JMXi-GAIN-CAL-IDX, which is read by j_cor_gain to perform the gain conversion.
In the gain correction program j_cor_gain the peak positions are divided by the positions at a reference time and then multiplied by the overall gain of the entire detector at that time, determined from the Xe fluorescence lines in blank field observations at the reference time. This gives the time-corrected gain conversion factor that is used to convert individual event or spectral PHA values to PI values.
In theory the detector ADC offset, G0, can be non-zero, but since an offset factor is already subtracted from the measured energy value by the on-board software, this value will in practice usually be zero. The value of the zero-energy ADC channel is determined by the electronic calibration procedure at the beginning of every revolution. Currently this corresponds to the value subtracted on board. If the zero-point ADC value changes an on-board patch can be used to return the offset value seen in the telemetry to zero again.
is the
gain slope or linear calibration parameter. See the lower part of figure
.
In practice G0 is zero and typical values of G1 are 0.07 KeV per ADC
channel for JEM-X1 and 0.05 KeV per ADC channel for JEM-X2.
No useful values of the gain parameters can be found if there is a problem processing the calibration spectra. This problem only arises when housekeeping packets are missing, and is relatively rare. Using either linear interpolation of the gain history table or the decay-model smoothing, makes an unbroken gain history in these cases.
Pre-launch testing of the flight models and experiments with the flight spare indicate that the strength of the FRSS sources illuminating small spots on the detector causes charging phenomena on the microstrip plate such that the gain at these points is not characteristic of the entire anode segment it represents and may also show sudden drops where small discharges occur. This problem is resolved by normalising the gain at each calibration point with the gain determined from the Xe line seen over the entire detector at a particular reference time for which we have plenty of blank-field data. Temporal changes in these normalised gains are then a direct reflection of the gain variation over the entire detector. Reference values of the Xe line and calibration source positions are stored in keywords in the header of JMXi-SPAG-MOD datastructure in the IMOD group (IC data).
Discharge glitches in the calibration spectra are smoothed out of the time variation correction by using a time-smoothing model across an entire revolution of data in j_cor_gain.
All data, including the FRSS spectra, are expected to show the 30-33keV Xenon fluorescence doublet to some extent. These lines are too weak to act as temporal gain variation markers but, at can determined from summing blank field data, how well gain determination functions over the entire detector area.
The correlation (gain) between the PHA and PI channels varies both in time due to temperature, pressure and voltage fluctuations, and across the surface of the detector.
The major part of the spatial gain variation arises from the
construction of the microstrip plate and the uniformity of the various
strips. This variation is stored as percent differences in line
ADC positions in data structure JMXi-SPAG-MOD (Table ). These
values
have been determined by pre-flight calibrations. However there are
secondary corrections to these tables, determined by in-flight
monitoring, to correct for dead and unstable anode strips.
This Data Structure contains
two 2D arrays along
and
axes with fractional change for each pixel
determined by pre-flight calibration in the first slice and secondary
corrections determined since launch in the second slice.
The list of the energy boundaries of
the PI channels can be found in JEMXi-*BDS-MOD Data Structure
(Tables ,).
Some more details can be also found in Section ).
In rebinning our events and spectra from PHA channels to PI channels, we can expect to introduce some inaccuracy into the energy measurements. However the PI channels are carefully chosen to reflect the inherent energy resolution of the detector, so this added error is small compared to the detector energy resolution.
| Column Name | Description |
| CHANNEL | Channel number |
| E_MIN | Minimum energy for this channel in keV |
| E_MAX | Maximum energy for this channel in keV |