In case of a staring the output images are in file
./picsit_ima.fitsFor each energy range and each type of event (single, multiple), 2 types of images, INTENSITY and SIGNIFICANCE, are produced. In case PICSIT_inCorVar=1, a variance map is also produced.
The list of found sources is in the file
./picsit_sky_res.fits
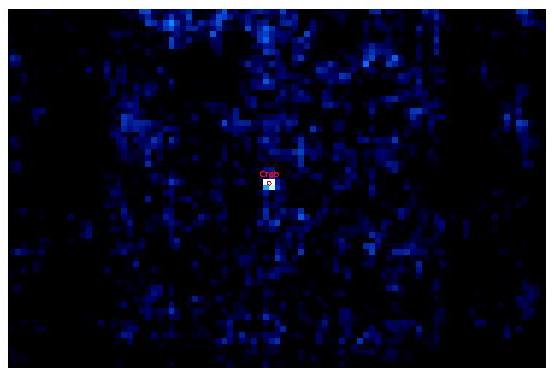
In our example the Crab is the only real source that was found.
In Figure ![[*]](crossref.png) you see the resulting image in the
keV
energy range. The Crab is clearly seen in the center. The figure was
produced
with the help of ds9:
you see the resulting image in the
keV
energy range. The Crab is clearly seen in the center. The figure was
produced
with the help of ds9:
cat2ds9 isgri_catalog.fits cat.reg symbol=circle color=red
ds9 picsit_ima.fits\[5] -region cat.reg \
                           -cmap cool -scale linear -scale limits 0 7 -zoom 8
In the case of observations with dithering pattern (staring=no), the pipeline performs the shadowgram deconvolution in every Science Window and the output files are under:
./scw/RRRRPPPPSSSF.001/picsit_ima.fits
./scw/RRRRPPPPSSSF.001/picsit_sky_res.fits
and the integration of all these images (mosaic) is in:
./picsit_ima.fits