Please consider that the validity of OSA11.X is currently limited to the recent data, since 2015-12-26 at 02:03:13 UT, i.e. from the beginning of the revolution 1626. The validity will be updated to past data as soon as possible. Regular updates for the more recent data are anticipated, as the instrument continues to evolve.
Please do remember that you are dealing with a coded mask instrument not with a focusing telescope and a CCD. It is not possible to deal with one source at a time: each source is background for the others, the whole field of view - and not just the few pixels around your source - matters!
In this Section, we guide you through your first IBIS
analysis, but please read also Section ![[*]](crossref.png) , where more details
on the main parameters are given. You could end up with fake
sources that are created by a blind use of parameters! More tips and
tricks are given in Section for advanced users.
, where more details
on the main parameters are given. You could end up with fake
sources that are created by a blind use of parameters! More tips and
tricks are given in Section for advanced users.
In the example below we analyze observations of the Galactic Center,
using data we have downloaded and installed as it is described in
Section .
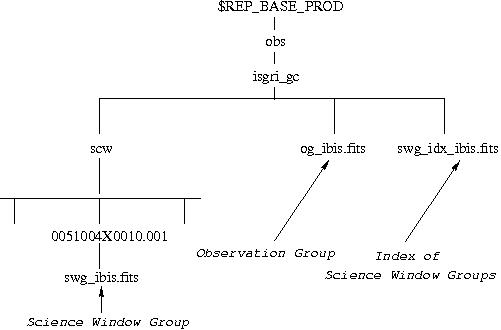
Create the Observation Group with the og_create program (see its description in the Toolbox section of [1]):
cd $REP_BASE_PROD
og_create idxSwg=isgri_gc.lst ogid=isgri_gc  baseDir="./" instrument=IBIS
As a result of the og_create command, the directory
$REP_BASE_PROD/obs/isgri_gc is created. In this directory
you find all you need for the analysis, its structure is illustrated
in Figure .