In case of a staring the output images are in file
./picsit_ima.fitsFor each energy range and each type of event (single, multiple), 2 types of images, INTENSITY and SIGNIFICANCE, are produced. In case PICSIT_inCorVar=1, a variance map is also produced.
The list of found sources is in the file
./picsit_sky_res.fits
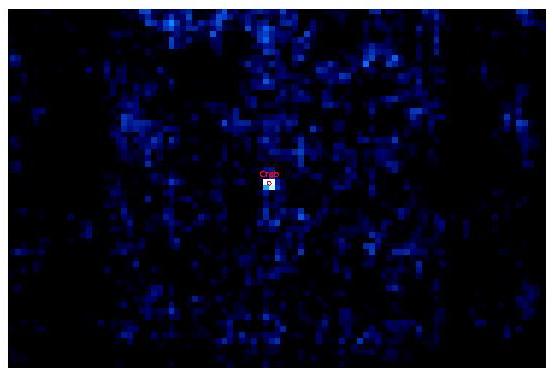
In our example the Crab is the only real source that was found.
In Figure 26 you see the resulting image in the keV energy range. The Crab is clearly seen in the center. The figure was produced with the help of ds9:
cat2ds9 isgri_catalog.fits cat.reg symbol=circle color=red
ds9 picsit_ima.fits\[5] -region cat.reg \
                           -cmap cool -scale linear -scale limits 0 7 -zoom 8
In the case of observations with dithering pattern (staring=no), the pipeline performs the shadowgram deconvolution in every Science Window and the output files are under:
./scw/RRRRPPPPSSSF.001/picsit_ima.fits
./scw/RRRRPPPPSSSF.001/picsit_sky_res.fits
and the integration of all these images (mosaic) is in:
./picsit_ima.fits