1. Imaging analysis
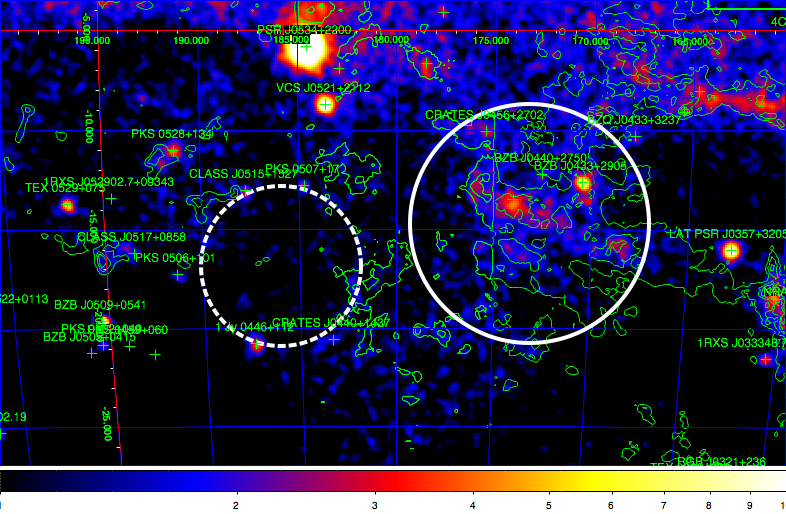
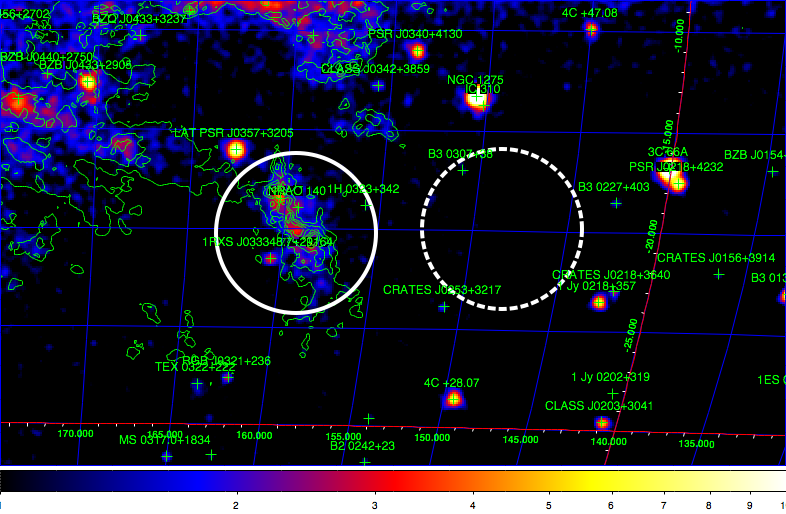 Figure 1. Count map
of Perseus OB2 cloud region in the energy range E>1 GeV smoothed with
a Gaussian of the width 0.3o. Green contours show CO emission
intensity with the levels 5,15,25,35 and 45 K km/s. Crosses show positions of
sources from the two-year Fermi catalog2. Solid and dashed white circles
are regions used to estimate the source and background fluxes.
Figure 1. Count map
of Perseus OB2 cloud region in the energy range E>1 GeV smoothed with
a Gaussian of the width 0.3o. Green contours show CO emission
intensity with the levels 5,15,25,35 and 45 K km/s. Crosses show positions of
sources from the two-year Fermi catalog2. Solid and dashed white circles
are regions used to estimate the source and background fluxes.
Figure 2. Same as in Fig. 1 but for the Taurus cloud.
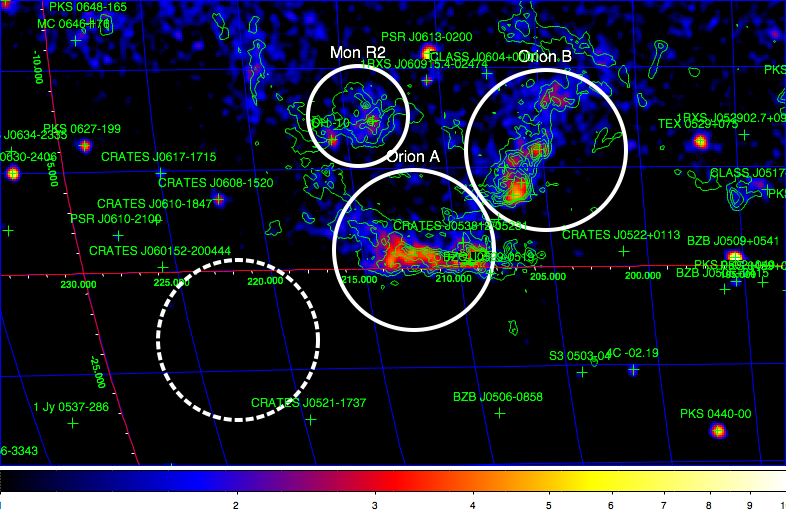
Figure 3. Same as in Fig. 1 but for
the Orion cloud region.
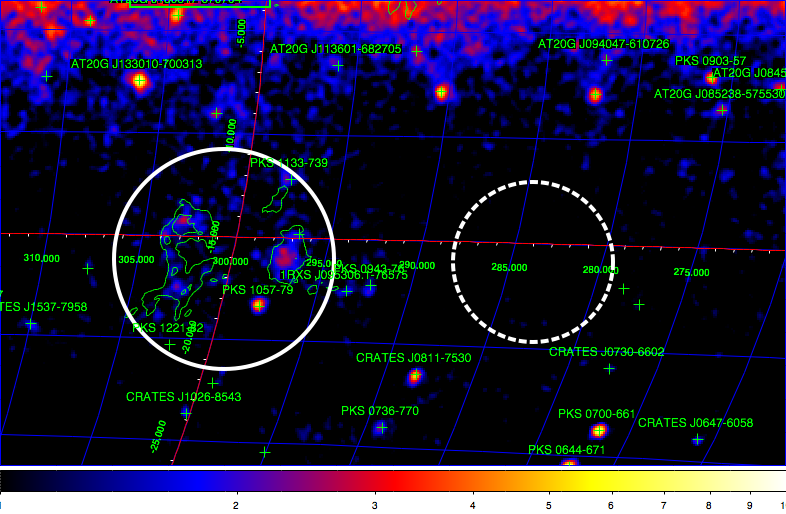
Figure 4. Same as in Fig. 1 but for
the Chameleon cloud region.
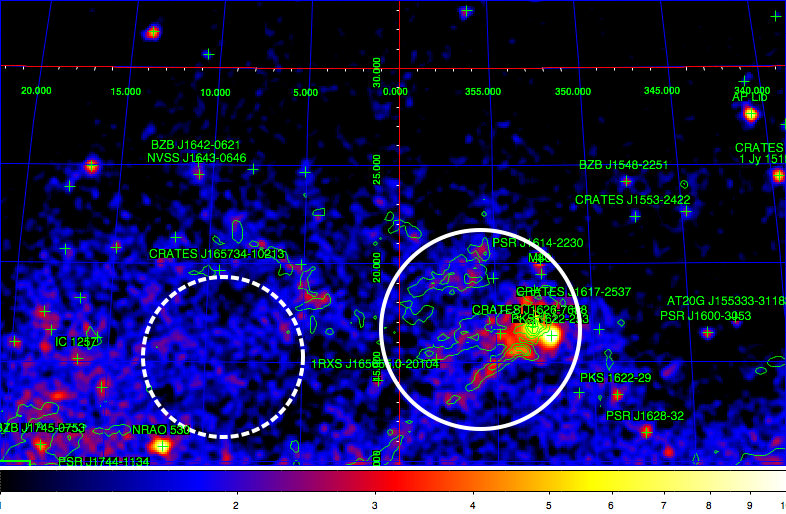
Figure 5. Same as in Fig. 1 but for
the ρ Ophiuchus cloud region.
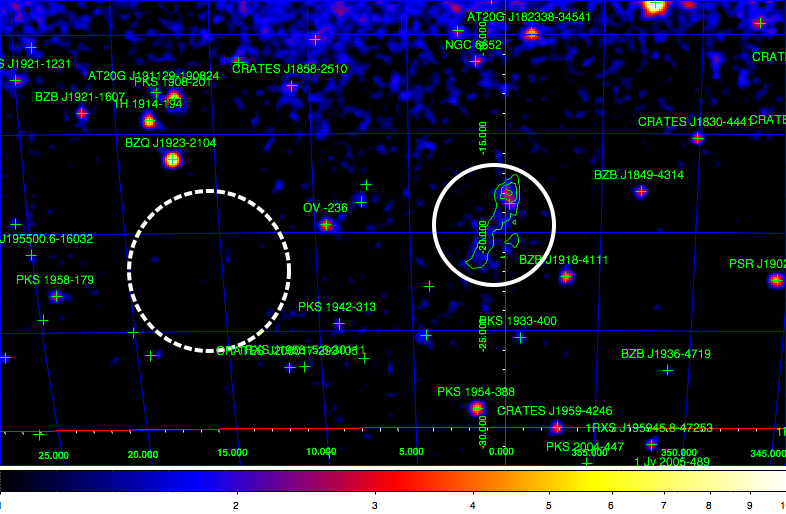
Figure 6. Same as in Fig. 1 but for the r Cr A
cloud region.
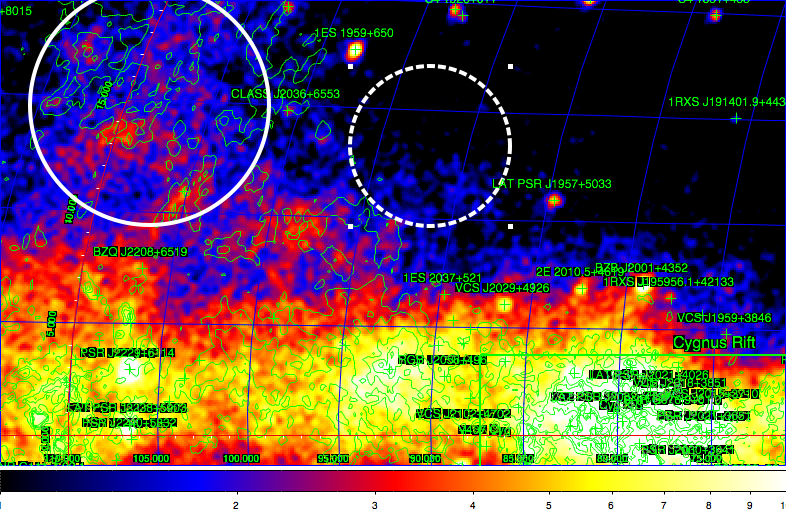
Figure 7. Same as in Fig. 1
but for the Cepheus cloud region.
2. Spectral analysis
2.1 Perseus OB2
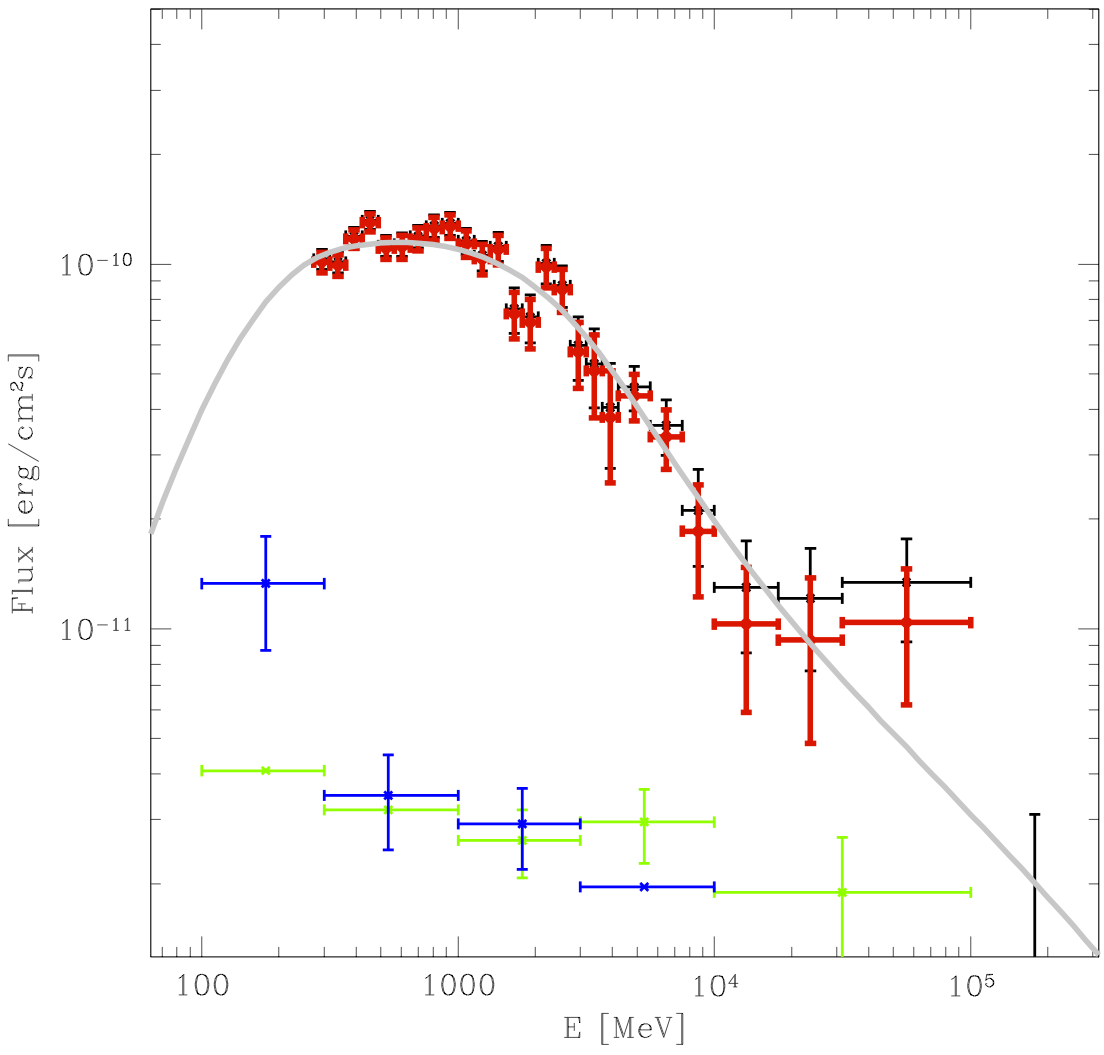
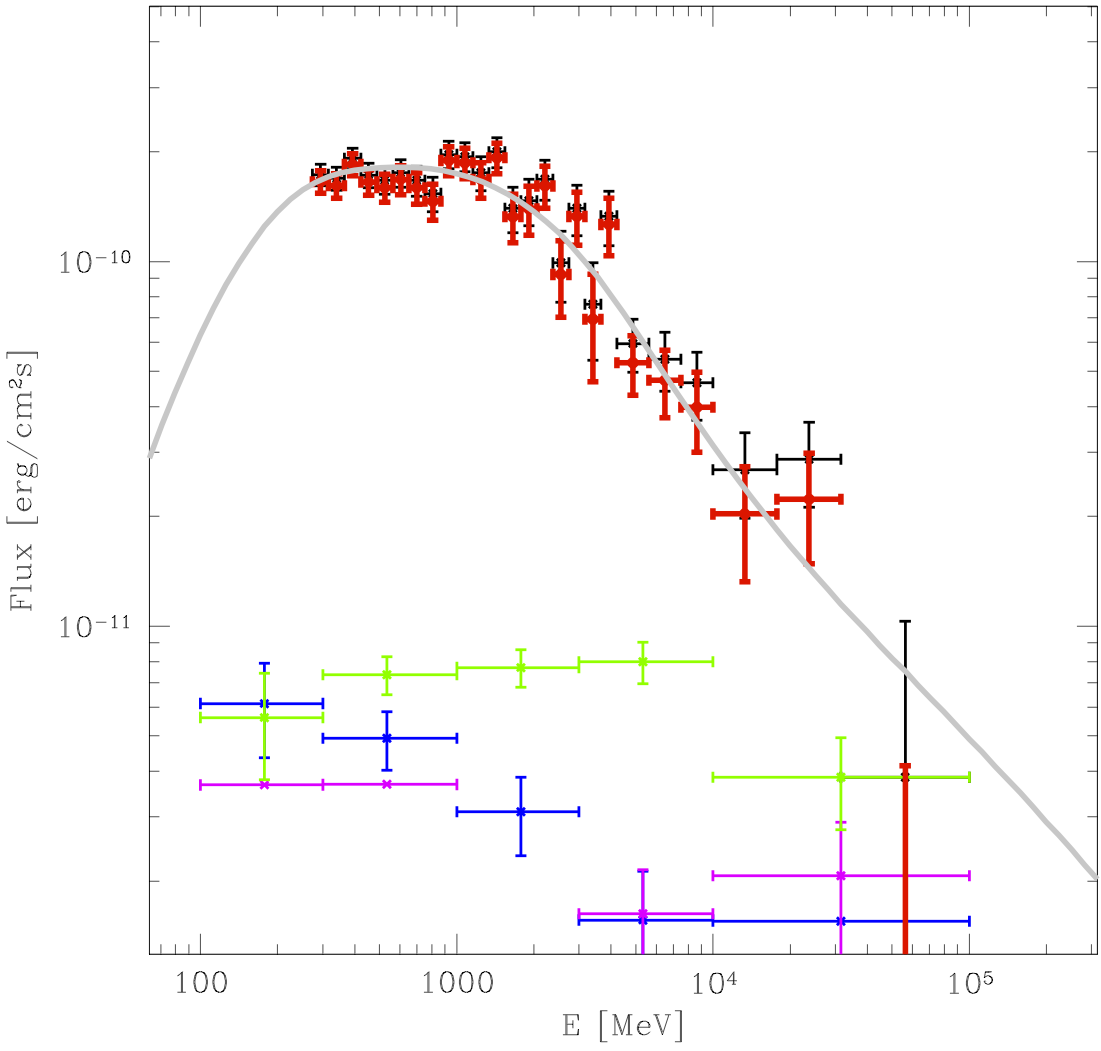
Figure 8. Spectra of Perseus OB2 (left) and Taurus
(right) clouds. Black data points
show the total background subtracted spectra of the source regions, red data
points are the spectra of diffuse emission. Other data points are spectra of
point sources from the two-year Fermi catalog3 which are subtracted
from the total source region spectrum in the estimate of diffuse emission
spectrum. Left panel: blue and
green thin data points show the spectra of NRAO 140 and 1RXS J033348.7+29164.
Right: green: BZB J0433+2905;
blue: CRATES J0456+2702; magenta: BZB J0440+2750. Points without y errorbars are upper limits.
From Fig. 1 we see that two point sources, identified
with a quasar NRAO 140 and an X-ray source 1RXS J033348.7+291643,
are situated in the middle of diffuse emission region. Spectra of these sources
reported in the two-year Fermi catalog
are shown by the blue and green thin data points in Fig. 8, left. We
subtract fluxes of these sources from the overall flux of the source region to obtain the estimate of diffuse
emission from Perseus OB2 cloud (shown in red in Fig. 8, left panel).
2.2 Taurus cloud
Taurus molecular cloud is closest to the Solar system GMC situated in the center of the Gould Belt4. It spans a large angular size of about 15o×15o in the direction close to the Galactic Anticenter. A large sub-cloud situated in the Auriga sky region is at Galactic latitude |b|<10o. We do not consider this part of the cloud in our analysis.
An unidentified source 2FGL J0440.5+2554c is clearly associated to the cloud, being positionally coincident with the excess of CO emission (Fig. 2). We consider this source as a part of diffuse emission from the cloud.
The source region of Taurus cloud, used for spectral extraction, contains two blazars BZB J0433+2905, BZB J0440+2750 with the spectra shown in Fig. 8. Spectra of these blazars are subtracted from the overall spectrum of the region in our spectral extraction procedure.
2.3 Orion A, B and Mon R2 clouds
The Orion molecular cloud is conventionally divided onto A and B sub-clouds, which are clearly distinguishable in the count map shown in Fig. 3.
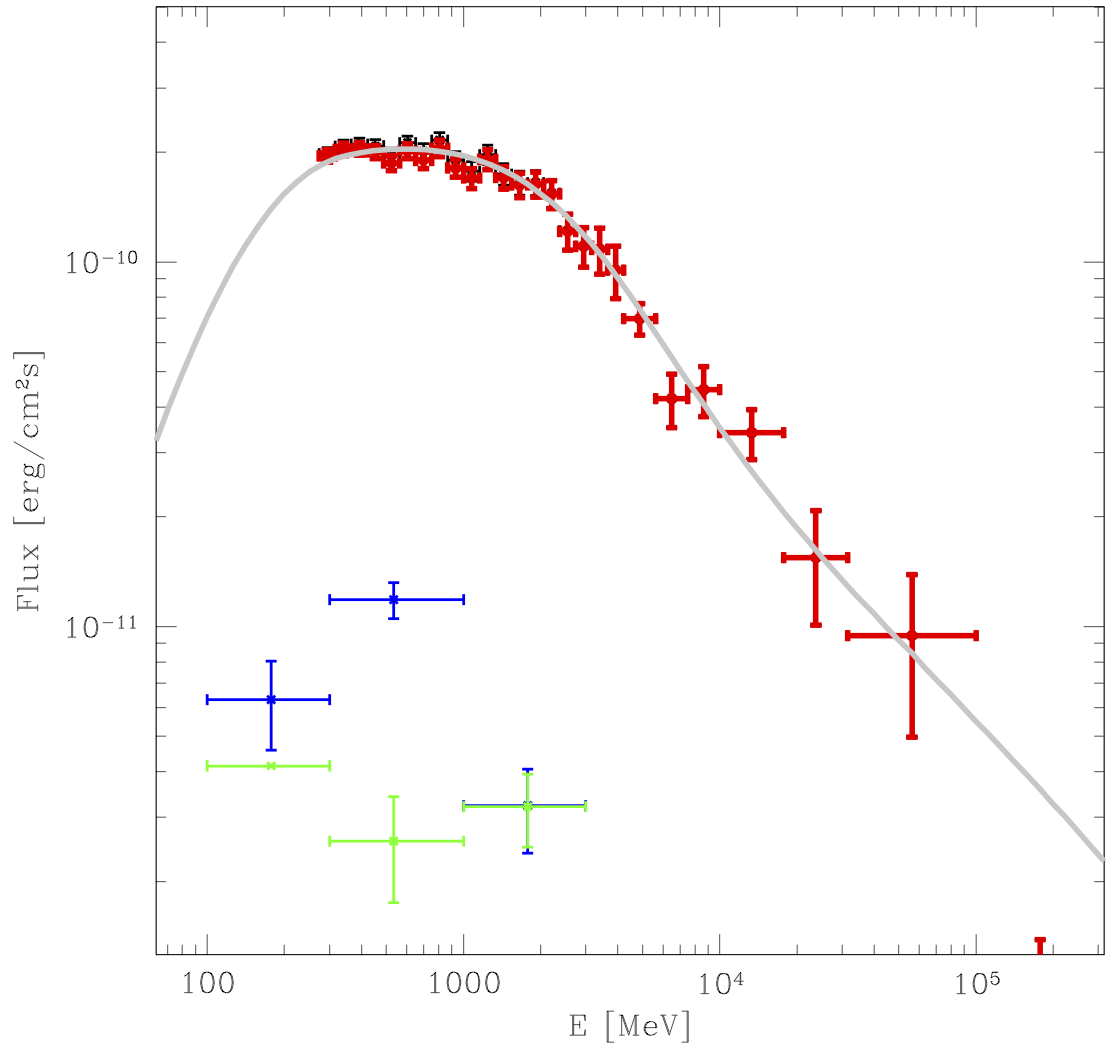
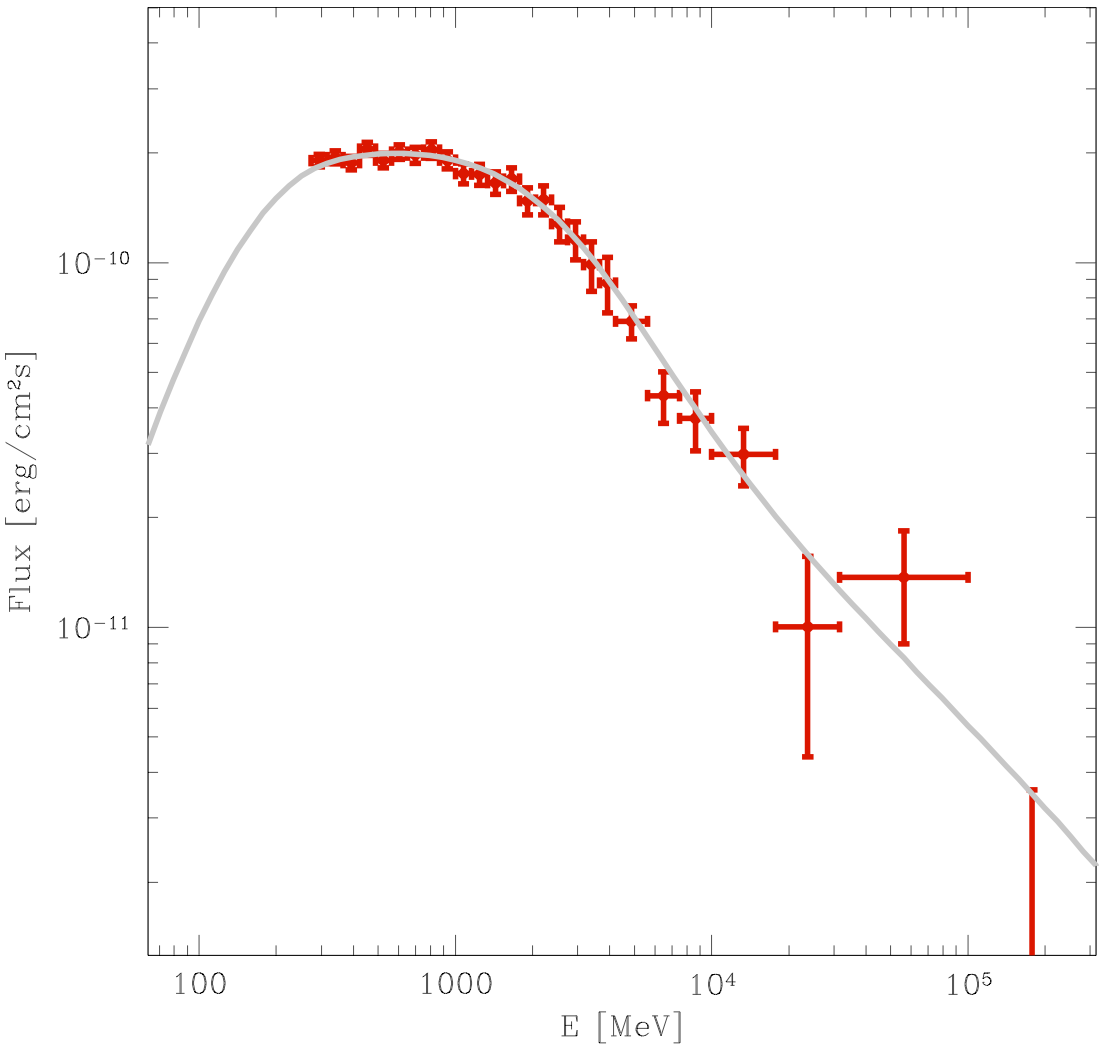
Figure 9. Same as in Fig. 8, but
for Orion A (left) and Orion B (right) clouds. Left panel: blue and green are
spectra of Crates J0538-05231; green: BZQ J0529-0519.
The unidentified Fermi sources 2FGL J0547.1+0020c, 2FGL J0547.5-0141c, 2FGL J0543.2-0120c, 2FGL J0541.8-0203c, 2FGL J0534.9-0450c, 2FGL J0534.8-0548c are most probably associated with emission from the Orion clouds themselves, as can be judged from the correlation of source positions with the excesses in the CO emission (Fig. 3). We do not subtract the spectra of these sources from the overall emission spectrum from the Orion cloud source regions when estimating the spectrum of diffuse emission.
Sources BZQ J0529-0519 and CRATES J053812-05231 situated inside the region used to estimate the source flux are identified with Flat Spectrum Radio Quasars (FSRQ) in the two-year Fermi catalog3 are subtracted from the overall source region spectrum (Fig. 9).
Mon R2 cloud region contains a point source OH-10, which is clearly not associated to the cloud emission and is subtracted in the spectral extraction procedure (Fig. 10). The cloud has small angular extent (2o radius circle is used in the spectral extraction). Taking this into account we consider only the data at the energies where the LAT PSF becomes smaller than the size of the region used for the spectral extraction and disregard the data below 1 GeV for this cloud (Fig. 10).
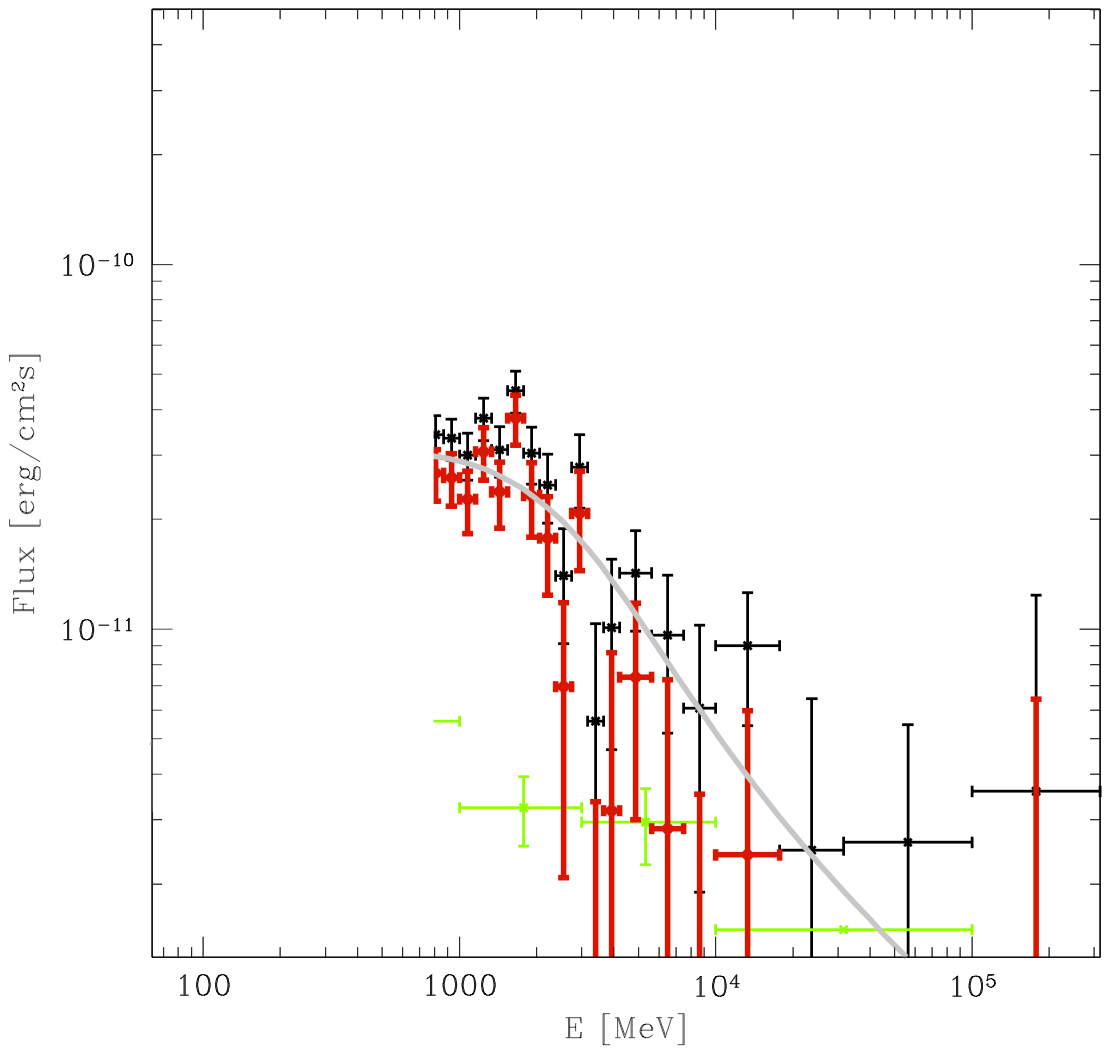
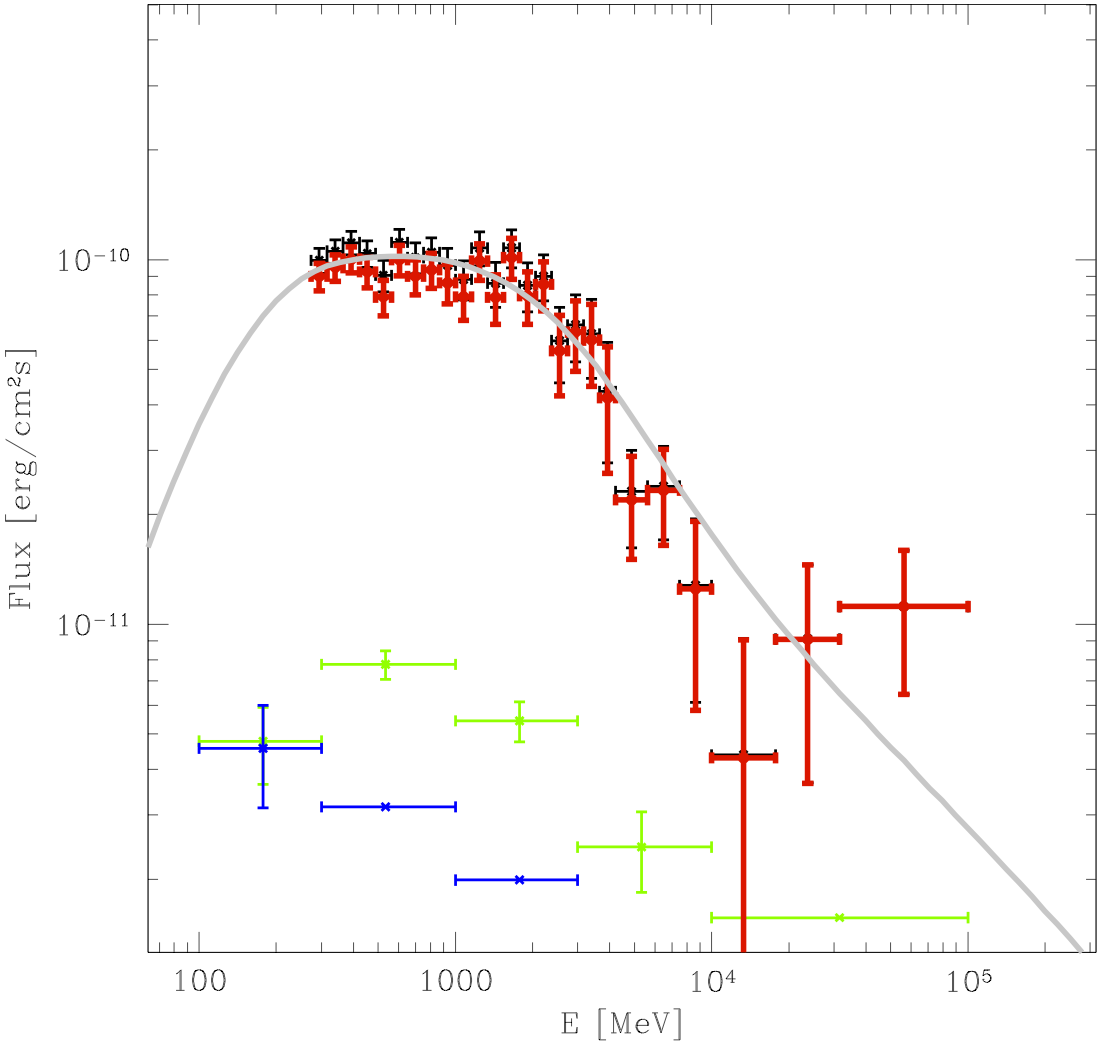
Figure 10. Same as in Fig. 8 but for Mon R2 (left) and Chameleon (right) clouds.
Left panel: green data are the spectrum of OH -10. Right: green data are the spectrum of PKS 1057-79,
blue data are for PKS 1221-82.
2.4. Chameleon cloud
Contrary to Perseus OB2, Orion A, B and Mon R2 clouds, which are situated in a low background Galactic Anticenter region, the Chameleon cloud is situated much closer to the Galactic Center, at Galactic longitude l~300o. However, at Galactic latitude b~-15o the diffuse γ-ray emission from the cloud region is clearly separated from the Galactic Plane diffuse emission as it is clear from Fig. 4.
Background sources PKS 1057-79, PKS 1221-82 and PKS 1133-739 are clearly not associated to the cloud. We subtract the spectra of these sources from the overall source region emission when estimating the spectrum of diffuse emission from the cloud (Fig. 10).
2.5. Rho Ophiuchus cloud.
ρ Ophiuchus cloud is situated in the Galactic Center region with strongly variable Galactic diffuse emission extending to high Galactic latitudes and numerous point sources (Fig. 5).
A pulsar PSR J1614-2230 could be clearly identified as a point source unrelated to the cloud diffuse emission. PKS 1622-253, a source identified with a blazar, not associated to an excess of CO emission, is, most probably, also a background source. However, the spectrum of this source, shown in Fig. 11, is similar to the spectrum of diffuse emission from the Gould Belt clouds. This might indicate that the source spectrum reported in the two-year Fermi catalog3 is contaminated by the diffuse emission from ρ Ophiuchus cloud. In this case subtracting the source spectrum from the overall spectrum extracted from the ρ Ophiuchus region we slightly under-estimate the diffuse flux from the ρ Ophiuchus cloud by up to 20%.
Situation is more complicated with CRATES J1626-7638. This source is identified in the two-year Fermi catalog as a blazar. At the same time, it is spatially coincident with a strong excesses in the CO map. Moreover, the source spectrum repeats the spectrum of diffuse emission from the Gould Belt clouds (Fig. 11). Taking this into account this uncertainty, we do not subtract the spectrum of CRATES J1626-7638 from the overall spectrum of ρ Ophiuchus source region when extracting the spectrum of diffuse emission from the cloud.
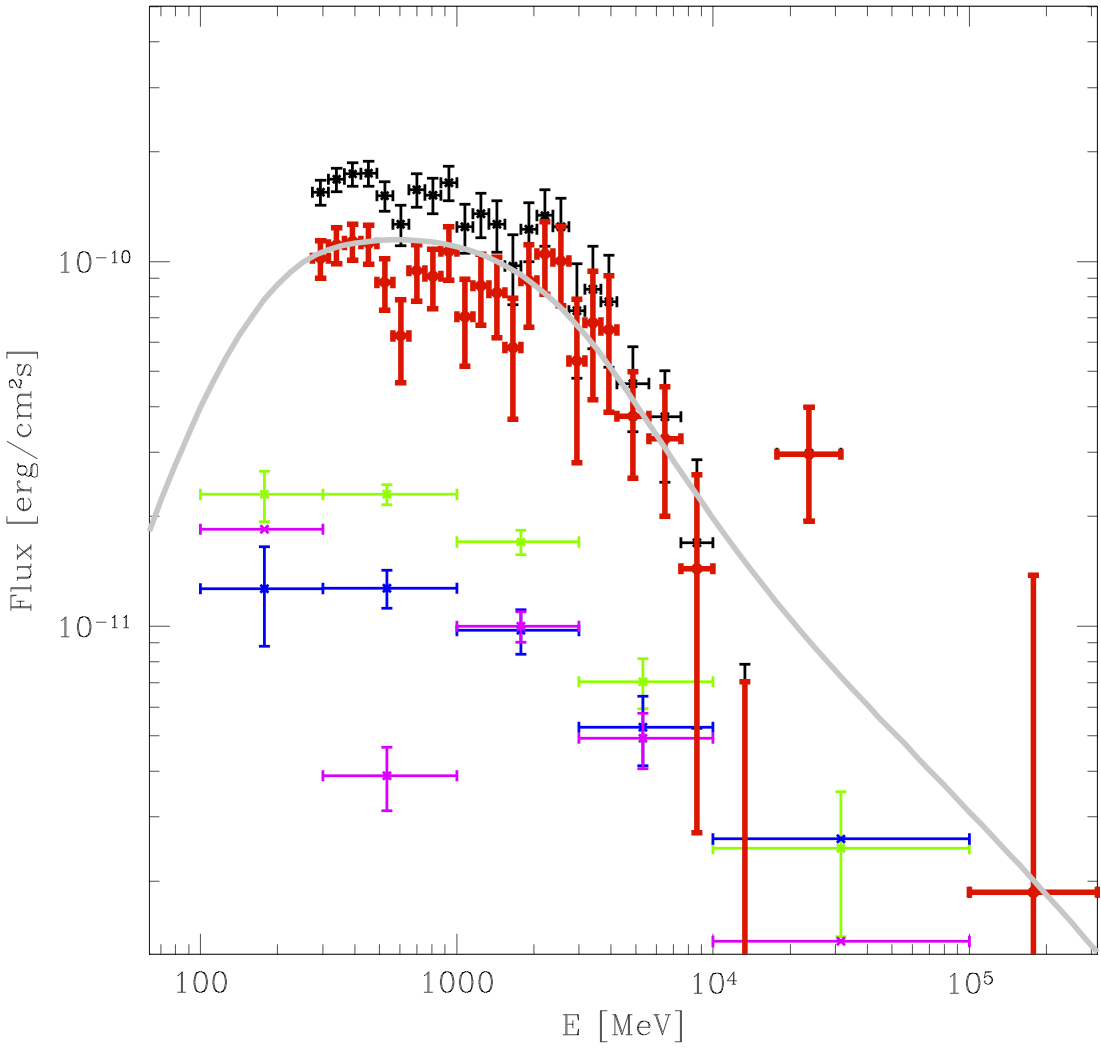
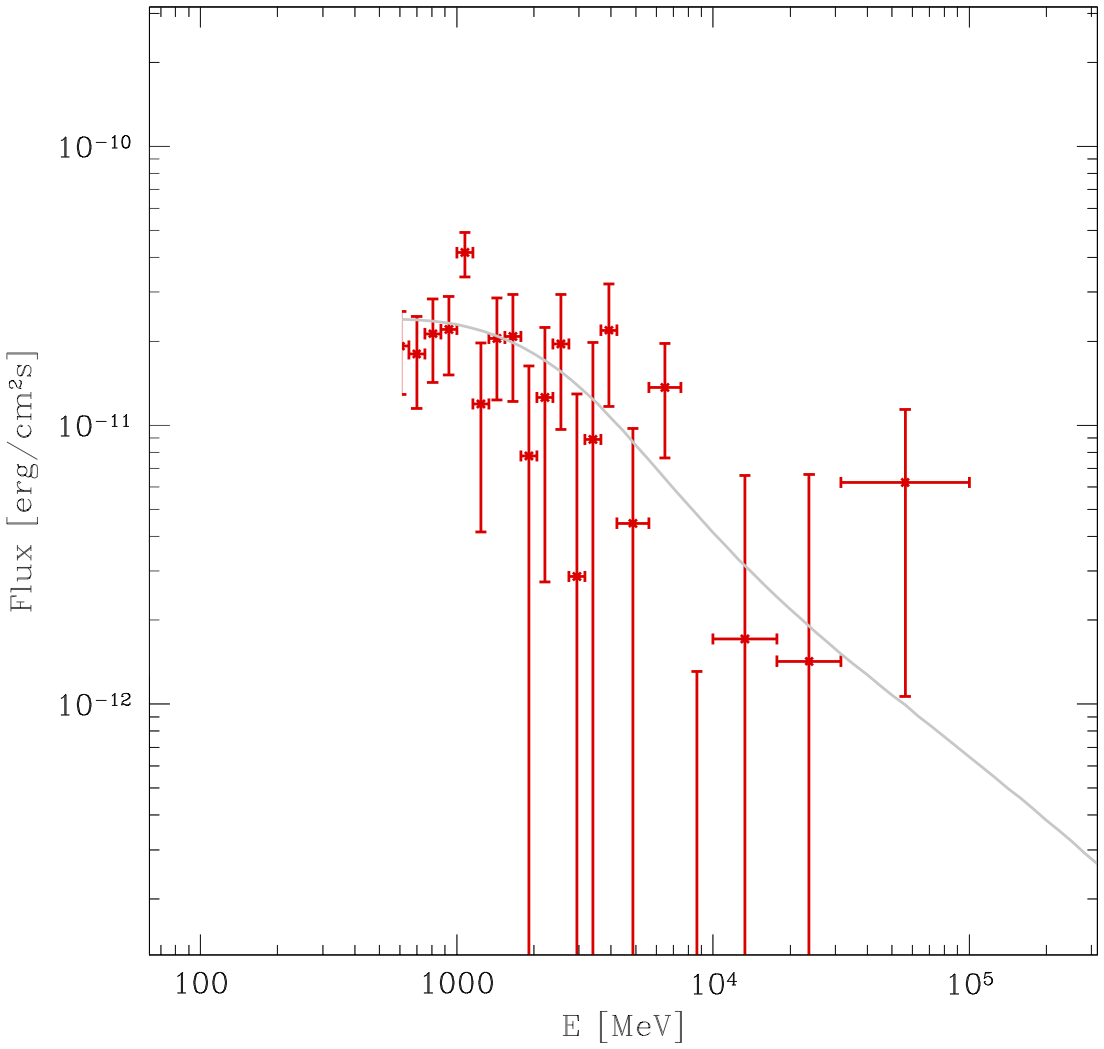
Figure 11. Left: spectrum of ρ
Ophiuchus cloud (red). Green: spectrum of PKS 1622-253; magenta: spectrum of
PSR J1614-2230; blue: spectrum of
CRATES J1626-7638. Right: spectrum of r Cr A cloud.
2.6. Corona Australis cloud
Corona Australis (r Cr A) cloud is located in the Galactic Center region at Galactic latitude b~-20o. In spite of the low mass of the cloud, γ-ray emission is detectable because of the proximity of the source5.
Maximum of the γ-ray signal coincides with an excess in CO emission (Fig. 6) and is located at the position of an unidentified Fermi source 2FGL J1904.9-3720c. We propose that this source is associated with the cloud emission and do not subtract the spectrum of this source from the overall spectrum of the source from the total source region spectrum (Fig. 11, right).
2.7. Cepheus cloud
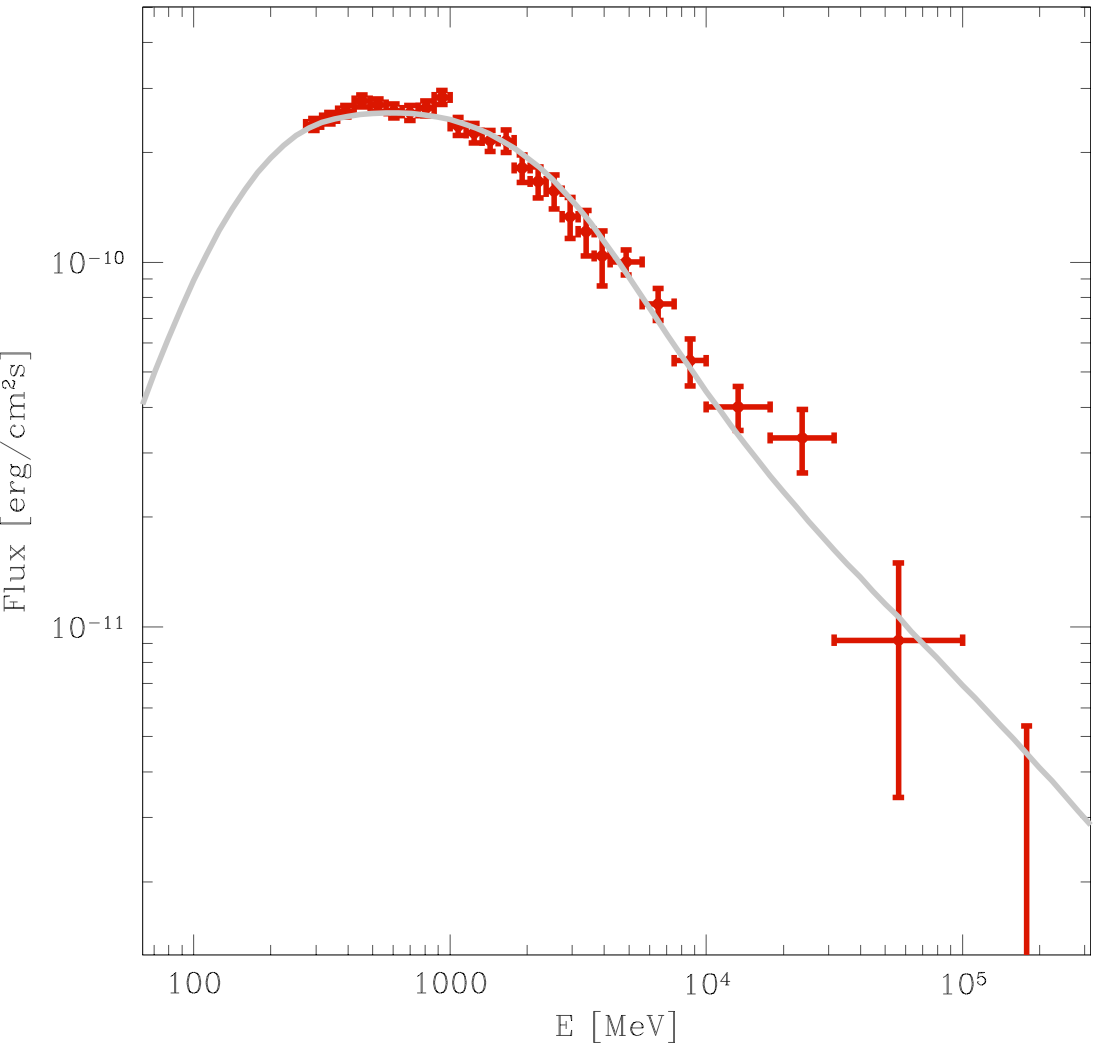
Figure 12. Spectrum of Cepheus cloud
(red). Grey: average cloud spectrum
Cepheus cloud is a bright and very extended γ-ray source situated just above the Galactic Plane in vicinity of Cygnus region (Fig. 7). An unidentified source from the two-year Fermi catalog3 is clearly associated to a strong excess in the CO emission map and we propose that this source should be identified as a clump in the cloud. We do not subtract the spectrum of this point source from the in our estimate of diffuse emission from Cepheus cloud (Fig. 12).
References
1. http://fermi.gsfc.nasa.gov/ssc/data/analysis/
2. Abdo A.A. et al., Spectrum of the isotropic diffuse Gamma-Ray emission derived from first-year Fermi Large Area Telescope data. Phys.Rev.Lett, 104, 101101 (2010).
3. http://fermi.gsfc.nasa.gov/ssc/data/access/lat/2yr_catalog/
4. Lampton M., Margon B., Bowyer S., Parameter estimation in X-ray astronomy. Ap.J., 208, 177 (1976).
5. Dame T.M., et al., A composite CO survey of the entire Milky Way. Ap.J., 322, 706 (1987).
6. Dame T. M.; Hartmann D.; Thaddeus P., The Milky Way in molecular clouds: a new complete CO Survey. Ap.J., 547, 792 (2001).