Next: Dithering Sensitivity Degradation
Up: Measured Performance
Previous: Spectral Resolution
Contents
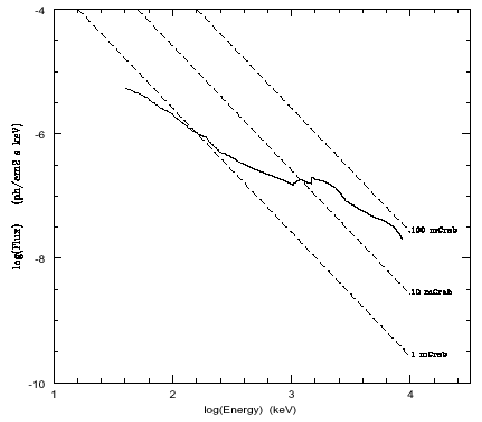
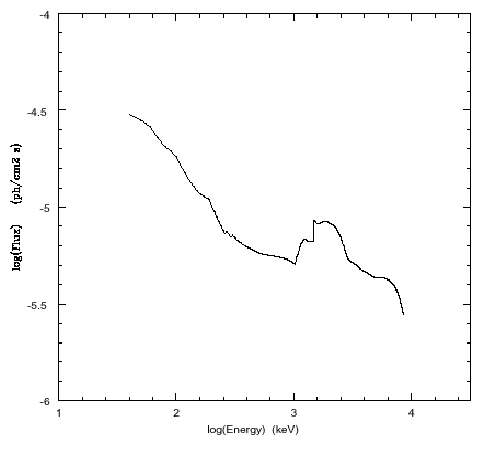
The continuum and line sensitivities of the SPI instrument are given
in Figure 7 and Figure 8., respectively. The continuum
sensitivities are for
, and are calculated using the
narrow line sensitivity divided by
,
where R is the instrument resolution for lines. The line
sensitivities are fluxes in photons cm
s
, the
continuum sensitivities are fluxes in photons cm
s
keV
. The line sensitivities are for narrow lines. The 511 keV
sensitivity is worse than the surrounding continuum due to the strong
511 keV background line originating in the instrument.
Figure 7:
The continuum sensitivity of the SPI
instrument for a 3 sigma detection in 10
seconds, on axis.
The fluxes are for
The dashed lines indicate
extrapolations from the X-rays using a powerlaw with photon index
-2 for 1, 10 and 100 mCrab.
|
|
Figure 8:
The narrow line sensitivity of the
SPI instrument for a 3 sigma detection in 10
s. Note
that the 511 keV line is not shown in this figure.
|
|
Next: Dithering Sensitivity Degradation
Up: Measured Performance
Previous: Spectral Resolution
Contents
inthelp@sciops.esa.int