To easily see the source lightcurve, you can open the file 4U1700-377.fits with fv and plot the column RATE with ERROR versus the column TIME, whereas to see the background lightcurve, you should plot column BACKV with error BACKE versus TIME. To display the resulting lightcurve it also convenient to use the lcurve program from the FTOOLS package:
lcurve
Number of time series for this task[1]
Ser. 1 filename +options (or @file of filenames +options)[file1] 4U1700-377.fits[2]
Name of the window file ('-' for default window)[-]
Newbin Time or negative rebinning[4.6692607009327] 100
Number of Newbins/Interval[10] 95	   (take this number from the line above:
                                    Maximum Newbin No. 95)
Name of output file[default]
Do you want to plot your results?[yes]
Enter PGPLOT device[/XW]
PLT> hardcopy 4U1700-377_lc.ps/PS
PLT> quit
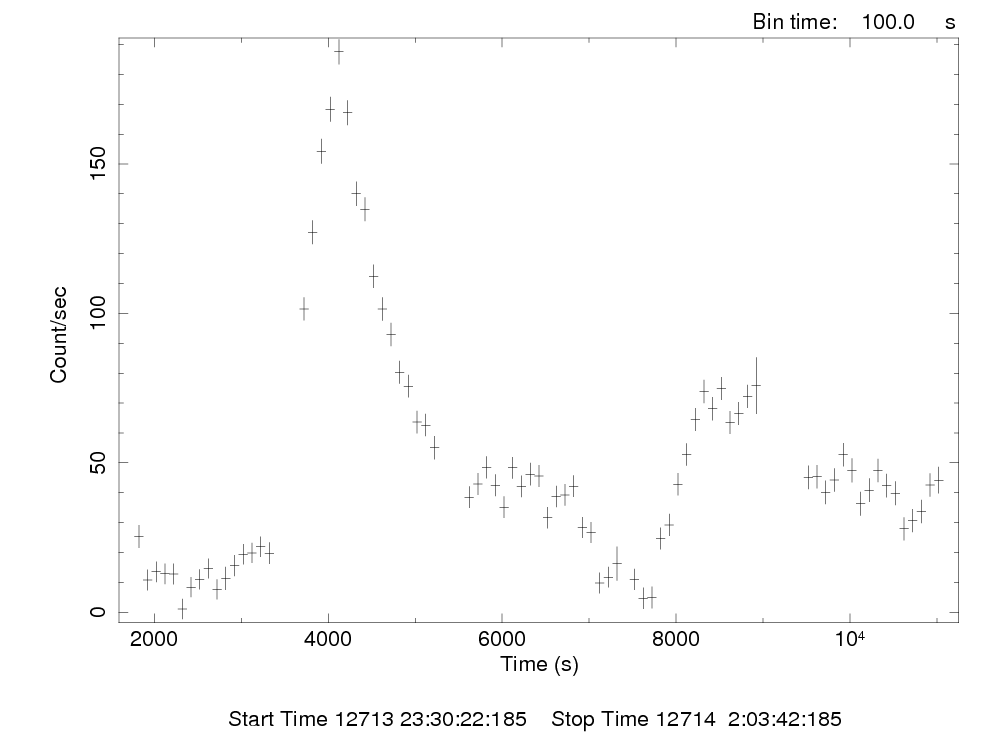
As a result, the 4U1700-377_lc.ps file was produced and is shown in Figure 21. Note that the count rates are already corrected for instrumental effects such as the off-axis transparency of the mask supporting structure.